Latest Blog Posts
Farm Management Apps

Popular Links
Security & Privacy
Company
Croptracker © 2026
Privacy Policy
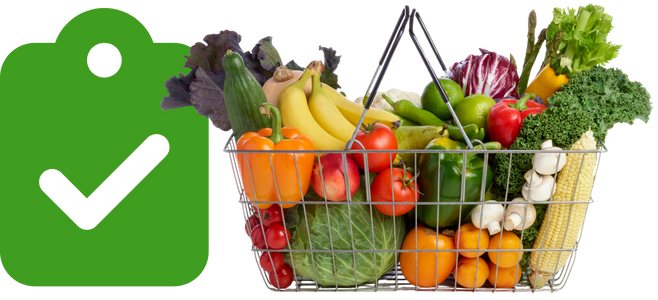
Quality control is one of the most critical aspects of profitable and sustainable fresh produce operations. The safety of the fruits and vegetables we eat relies on accurately inspecting, testing, and grading standards and processes.
In today’s globally interconnected food economy, quality control tests are performed at several stages throughout the supply chain, from cultivation and harvesting to processing, packaging, transportation, and distribution.
Quality control processes are designed to not only ensure quality and shelf life are maximized, but also to comply with increasingly demanding regulatory and food safety complicance standard. This resource page is a compilation of some of the resources and knowledge Croptracker’s support staff have amassed during our 20+ years supporting the fresh produce industry to help our users meet these goals.
Quality control in fresh produce relies on replacing subjective opinions with objective, quantitative, and traceable measurements. Objective quality attributes determine the product’s appeal, flavor, and resilience throughout the supply chain. The following is a list of the most critical and common objective QC parameters used in grading, sorting, pricing, and predicting the consumer quality of fruits and vegetables:
Brix, or Degrees Brix, is a measure of the total soluble solids present in the fruit. Total Soluble Solids (TSS) are primarily made up of sugar (usually at least 80%) but may also include soluble acids like citric acid, vitamins like A and C, or other compounds. Generally though, when we talk about Brix values, it's about sugar. Brix testing is done at various points in the fruit's lifecycle, in preharvest testing it is often used as part of a maturity index. In the post-harvest world, Brix testing is used primarily to objectively assess flavor and sweetness of produce.
Acidity testing in fresh produce quality control refers to the measurement of the total amount of organic acids present in the fruit or vegetable. This is typically done through a method called titratable acidity (TA). Titratable acidity measures the total acid concentration in the food, as opposed to pH which only measures the active hydrogen ion concentration (acid strength). TA is a better indicator of the tartness or sourness of the product, which is crucial for flavor. Acid content naturally decreases as most fruits ripen, as acids are often converted into sugars. Measuring TA helps determine the optimal harvest time and stage of maturity.
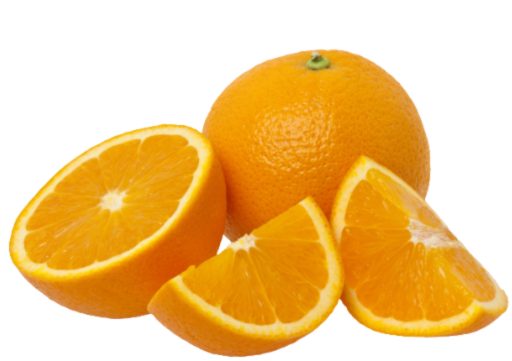
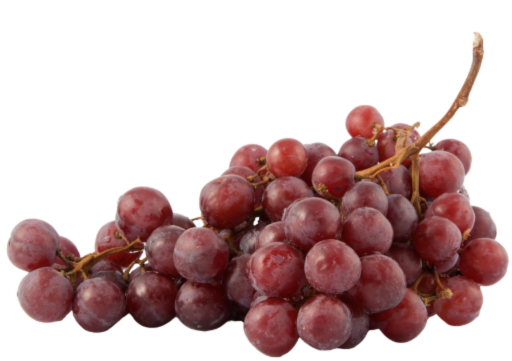
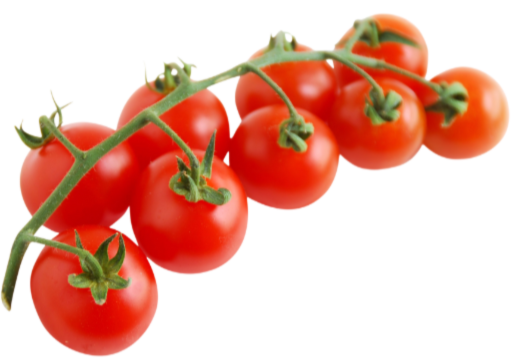
The Brix / Acid ratio, also known as the Sugar-to-Acid ratio, is a critical quality index that combines Titratable Acidity (TA) and Degrees Brix. This ratio is one of the most reliable indicators of the eating quality and maturity of many fruits, especially citrus, grapes, and tomatoes. A higher ratio generally indicates a sweeter taste, which is preferred by most consumers, because it means there is more sugar relative to the tart-tasting acid. Regulatory and industry quality standards often specify a minimum Acid/Brix ratio that fruit must meet before it can be harvested, packed, or sold to ensure a consistent and enjoyable consumer experience. The ratio is calculated by simply dividing the Brix value by the Acidity value
Starch is a type of carbohydrate found in various plants, including apples. During the ripening process of apples, the starch gradually converts into sugar. The level of starch in an apple is used as a metric to determine its ripeness, with higher starch levels indicating a less ripe fruit. A critical preharvest test in the apple industry, the starch iodine test is the most common method of calculating ideal harvest windows for apples going into storage.
Dry matter measurement represents the total solids in a piece of fruit, including starches, proteins, sugars, fiber, and carbohydrates. A dry matter measurement is most simply explained as the total weight of the fruit, minus the water content. Dry matter accumulation changes throughout the fruit growth cycle and is used as a maturity indicator in some climacteric fruits. Dry matter testing is typically done by weighing fruit samples, then dehydrating them and weighing them again, subtracting the dried weight from the fresh weight to determine the dry matter ratio. Non-desutructive testing methods for dry matter testing are being embraced more frequently to speed up this process and enable larger sampling sizes.

Firmness / Pressure testing assesses the internal pulp firmness of a given fruit, which corresponds to the crisp, crunchy experience of eating fresh fruit. The main method of testing firmness is using a penetrometer, which is a device that measures the pressure and compression needed to puncture the flesh of the fruit. Durometers are alternative testing tools that do not puncture the fruit but similarly measures the resistance of the fruit or vegetable flesh to compression. Commercial fresh produce QC operations rely on standardized units of measurement, primarily pounds-force (lbs or lbf), Newtons (N), and occasionally kilograms-force per square centimeter kgf/cm2.
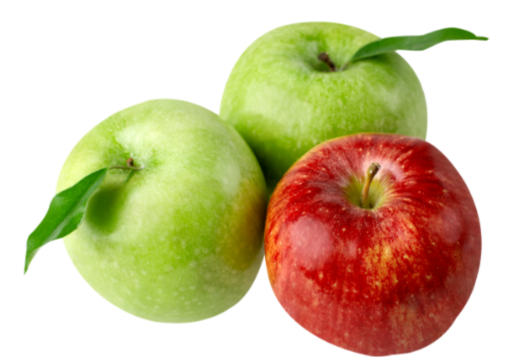
Often when consumers think of fresh produce QC metrics, they are not typically thinking of a specific Brix number or the starch scale score, they are referring to the external and visual qualities of a piece of fruit. Although many of these metrics don’t impact the taste of the fruit, visual characteristics, like color and shape, have a huge impact on the marketability and profitability of fresh produce.
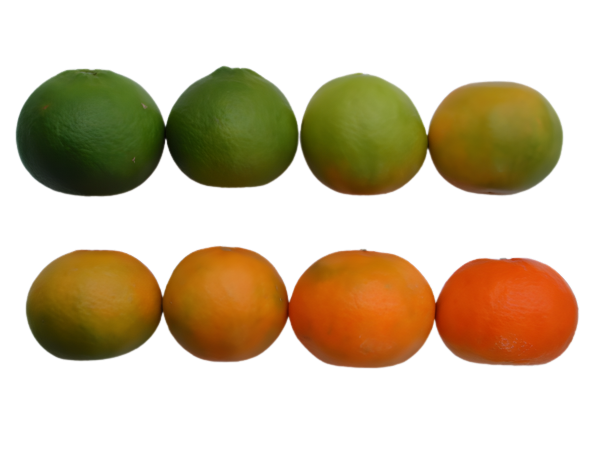
Color changes as fruit matures and ripens, and judging the ripeness of fruit by the external color is one of the oldest methods in the book. Different crops have different ripening processes, and the external color of the fruit isn’t always the most important metric. Internal color assessment can be used to track maturity and ripeness in types of fresh produce that don’t change color externally.
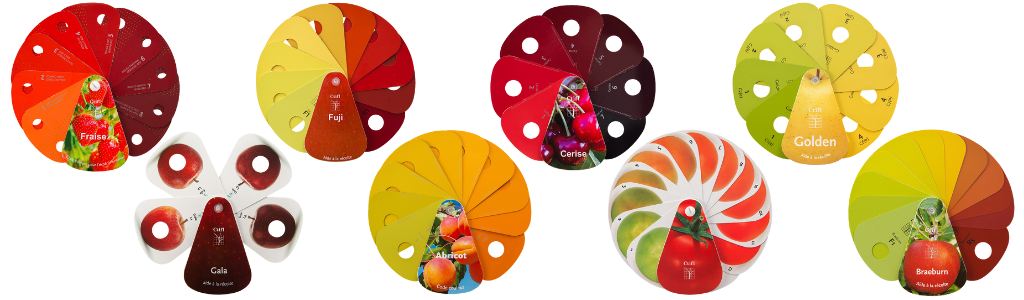
Color is also one of the most important factors for consumer acceptance of produce, so consistent color metrics are a critical part of a quality control assessment. Fruit color can impact both the grade and price of harvested fruit, and in some cases, postharvest color development needs to be induced. Quality Control experts will often have reference color guides to help them make color assessments from samples, though these cards are not always reflective of real life color and conditions and must rely on the accurate color vision of the person doing the assessment. Recently, portable tools for color assessment have been gaining popularity to help better handle this subjectivity.
For some fruits, the color during harvest is not the target color for retail. Bananas and citrus for instance are often picked green before they ripen on the tree, so that transportation and ripening time can be better aligned. Citrus in particular is often tightly color controlled using Degreening processes.
When a lemon ripens and acquires that signature lemon yellow color, this is the process known as "degreening". The lemons lose their green chlorophyll during the cold nights on a tree as it ripens. However, in some climates, the degreening process may not be fast enough to color up the fruit before it ready to be harvested. When this happens degreening needs to be induced through post-harvest treatments.
Citrus destined for degreening is assessed by Quality Control staff and the length of time the lot of fruit will spend in the degreening rooms is determined by how green the fruit is and how long it will take to reach the desired color. Degreening rooms are sealed rooms that use ethylene gas at measured levels, enough to leach the chlorophyll from the fruit skin, but not applying too much so as to over ripen the fruit.
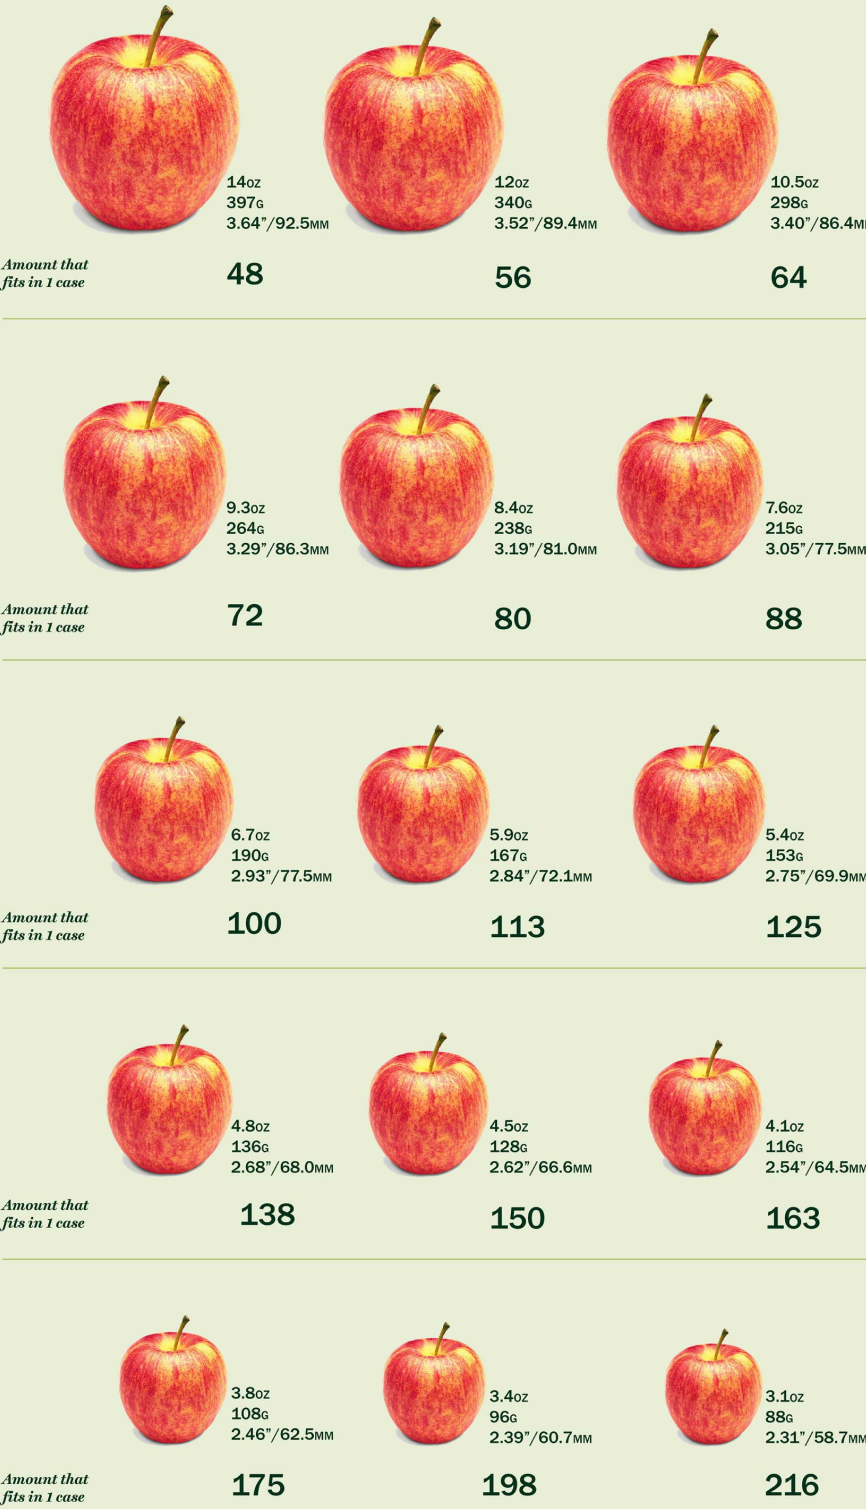
Size and shape grading are crucial quality control steps in the fresh produce industry, primarily aimed at achieving market uniformity and consistency. This process begins with defining standards, often set by regulatory bodies, that specify the acceptable dimensions (like diameter or weight) and the characteristic form (or 'well-formed' shape) for a particular fruit or vegetable variety.
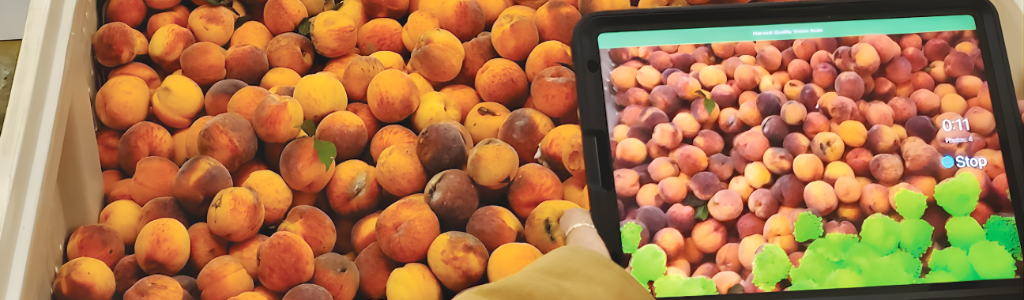
Prior to fruit heading to storage or to packing, trained workers visually inspect and predict how the lot of fruit will pack out. They can use a variety of tools and references to help with this process including ring sizers, defects shape guides, and more sophicticated digital size and shape assessment tools like Harvest Quality Vision.
Modern packing houses use sophisticated, high-speed technologies to automate the sorting and culling of fruit by size and shape. These systems include mechanical sizers, which use physical mechanisms like divergent rollers or weight scales to separate items based on their size or mass. The most advanced technique is automated machine vision grading, which utilizes high-speed cameras to capture images of the produce from multiple angles. Specialized software then analyzes these images to calculate precise dimensions and evaluate the shape against an ideal template.
Ensuring uniform size and shape is vital because it simplifies the packing and shipping process, maximizes the use of carton space, minimizes damage during transit, and crucially, helps establish consistent packing and pricing options that meet specific customer and market expectations.
In fresh produce quality control, a defect is any physical characteristic or condition that causes a fruit or vegetable specimen to fall below the minimum specified quality standard for its intended grade or market. These issues can be caused by various factors, including growth problems (e.g., scarring, sunburn), post-harvest damage (e.g., bruising, cuts, stem punctures), or the presence of disease or decay, all of which negatively impact the product's appearance, edibility, or shelf life.
Often resources for scouting and spotting defects are made for specific commodities by governmental agencies and univeristy extension programs. QC staff are trained on the most common defects to look for based on the crop and the growing location and then must assess if the defect damage is at an acceptable level for a specific grade. Fresh produce defects can generally be grouped into the following categories:
Growing defects occur as a result of environmental factors that affect the shape, size, appearance, or texture of the fruit. Some of the most common growth defects are:
Picking defects occur during harvest and are typically caused by rough handling. While many harvest defects may appear small or innocuous, any wound or damage to fruit may leave it open to a secondary infection or infestation.
Even after the harvest, transportation and sorting are done, stored fruit and vegetables aren’t immune to damage. Climate-controlled storage presents its own set of issues and risks. Storage disorders affect produce in long term storage and may produce undesirable flavors, affect texture, or even cause visible damage. These disorders include various kinds of storage rot and fungal development, as well as other physiological disorders.
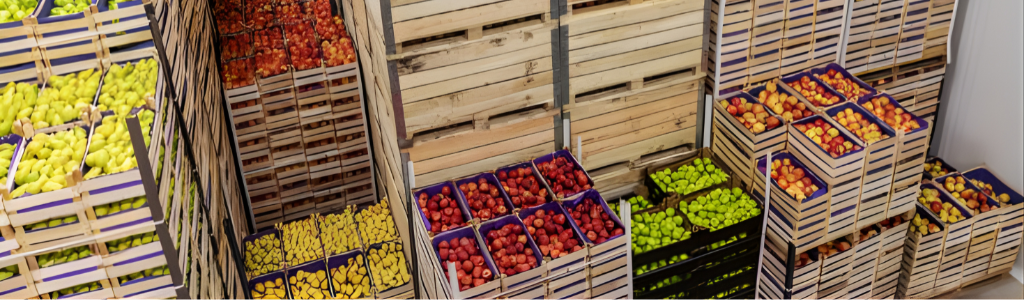
Produce grading is the systematic process of sorting fresh fruits and vegetables into distinct classes based on measurable quality parameters, which include appearance, precise dimensions (size and shape), characteristic pigmentation (color), texture (firmness), and, critically, the absence of defects or flaws. Grading involves categorizing the produce—often into designations like U.S. No. 1 or Extra Class—to ensure consistency and meet specific market expectations. These quality control measures strictly adhere to detailed standards set by regulatory bodies (like the USDA or EU), industry associations, or individual market requirements.
Examples in Practice
These standards define the acceptable range of variation for various produce types and are essential for facilitating international trade, establishing price points, and ultimately, ensuring consumer satisfaction and trust.
A quick note about the simplest and perhaps most common starting place when it comes to fresh produce quality control: taste testing! These quality checks rely on the senses of sight, smell, touch, and sometimes taste to evaluate the quality and freshness of produce. Sensory evaluation can provide valuable information about the qualitative characteristics of fruits and vegetables, helping to determine their ripeness, texture, and overall desireability for sale. During sensory evaluation, quality control inspectors examine the produce visually, looking for any external defects such as discoloration, bruises, cuts, or blemishes. They assess the overall appearance, including color, size, shape, and uniformity, as these attributes are often associated with quality and consumer preference.
While sensory evaluation is a valuable tool, it's important to acknowledge that it has inherent subjectivity. The perception of sensory attributes can vary among individuals, and personal preferences may influence evaluations. To mitigate this subjectivity, sensory panelists undergo training to develop a common vocabulary and understanding of quality attributes. Standardized evaluation protocols and reference samples are often employed to minimize variability.
Post harvest, after fresh produce products has been inspected for core quality metrics, a large part of continued quality control is about monitoring the environment the fruit is stored in. Optimal storage conditions will of course vary depending on the fruit or vegetable largely depending on how the fruit ages. Before we dive into the metrics to monitor, we have defined some key terms in fresh produce maturity and storage manegement.
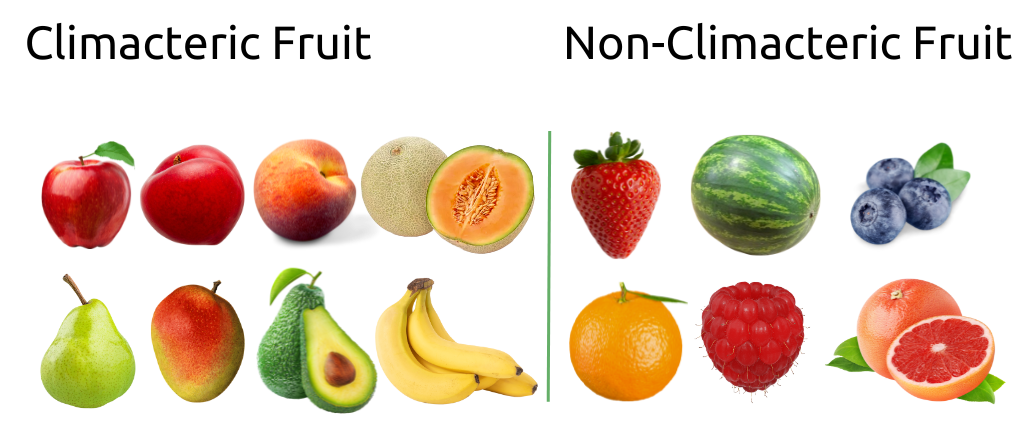
Put simply, Climacteric fruit like apples continue to ripen after they are picked. These fruits will continue to ripen in storage or during transportation after harvest. Climacteric fruit produce more ethylene than non-climacteric fruit like strawberries, which won't become fully ripe after separation from the plant.
Climeractic fruit can be harvested immature (but not fully unripe) and then ripened on demand during storage or transit. Storage management focuses on reducing ethylene levels (using scrubbers or controlled atmosphere) and lowering temperature to delay this climacteric surge and extend storage life.
Non-climeractic fruit must be harvested when they are fully ripe because they will not significantly improve in quality after picking. Storage management focuses on minimizing water loss and decay, as ethylene exposure will simply accelerate senescence without improving ripeness.
Senescence is the final, irreversible stage of aging in fresh produce, following maturation and ripening, characterized by a breakdown of the fruit cell components and loss of quality. Visually, it manifests as yellowing, softening, loss of crispness, and increased susceptibility to decay. All post-harvest quality control techniques, such as cooling, humidity control, and controlled atmosphere storage, are ultimately designed to delay the onset of senescence for as long as possible.
Respiration is the metabolic process in which stored organic materials (like sugars and starches) within the plant cells are broken down using oxygen (O2) to release energy, carbon dioxide (CO2), and heat. It is essentially the produce "breathing." The respiration rate is inversely related to shelf life. Produce with a high respiration rate, like broccoli, asparagus and sweet corn, means the produce is consuming its stored food reserves, generating a lot of heat of respiration that must be continuously removed by cooling. These products deteriorate quickly, resulting in rapid loss of sugar, firmness, and nutritional value, demanding immediate and rigorous cold chain management to slow this rate. Low respiration rate crops, like apples, potatoes and citrus, have a slower metabolism, allowing for much longer storage periods when maintained under optimal conditions. Storage and Quality Control management seek to keep the respiration rate as low as possible for longer storage life.
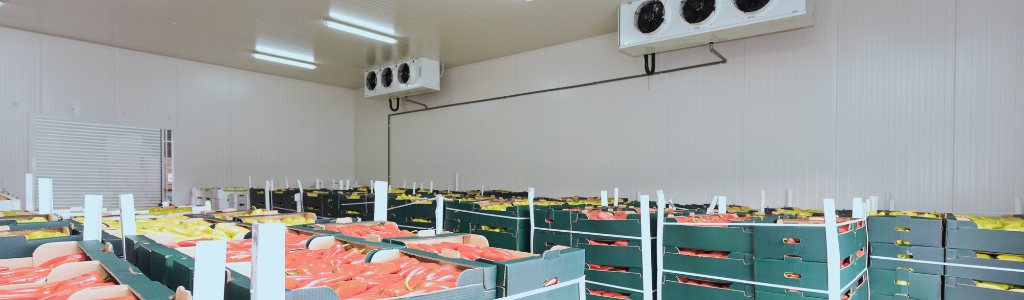
Cold storage is the storage method for the preservation of most fresh produce products. It relies primarily on maintaining a low, consistent temperature (just above the freezing point of the produce) and often high relative humidity. Lowering the temperature drastically slows down the respiration rate and metabolic processes of the fresh produce, delaying ripening and the onset of senescence. The low temperature also inhibits the growth of spoilage microorganisms.
Controlled Atmosphere (CA) storage is a more advanced technique that uses cold storage as its foundation, but supplements it with rigorous gas management within a sealed, airtight room. In CA rooms, temperature, humidity, Oxygen (O2), Carbon Dioxide (CO2) and often Ethylene (C2H4) are closely monitored and controlled.
CA storage creates a state of controlled dormancy for the fruit inside by actively reducing the oxygen level (typically from 21% down to 1% - 5%) and sometimes slightly increasing the carbon dioxide level. This manipulation of gas composition slows the respiration rate beyond what temperature alone can achieve. The removal of ethylene, the ripening hormone, further inhibits maturation.
This process is used mainly for long-term storage of climacteric fruits like apples and pears, allowing them to be harvested in the fall and marketed year-round while retaining their firmness and quality for 2 to 4 times longer than in standard cold storage. CA requires sophisticated equipment like nitrogen generators and CO2 scrubbers for continuous monitoring and adjustment.
Monitoring storage temperatures is vital to ensure a slowed respiration rate and to inhibit the growth of bacteria and mold. Maintaining the optimal low temperature is the single most effective way to delay senescence and preserve firmness.
Continuous temperature monitoring uses thermocouples or digital sensors placed within the produce bins, in transport containers, and on the walls of the storage facility. Effective Quality Control processes will ensure the temperature stays within the narrow, ideal range for the specific commodity, avoiding both freezing and chilling injury thresholds. Some monitoring systems will integrate automatic temperture data logging systems so this record does not have to be a manual process and can be monitored remotely.
Humidity monitoring during storage is primarilty to prevent water loss (dessication), which will lead to wilting, shriveling and shrinkage, and a loss in quality and marketability ultimately.
Humidity monitors (like hygrometers) will return a Relative Humidity (RH) score. In many fresh produce storage environments, the goal is to maintain high humidity (90-98%), usually this is acheived with humidifier systems or some old fashioned floor wetting.
These three gases are primarily monitored in Controlled Atmosphere (CA) storage to induce a state of dormancy beyond what cold temperatures alone can achieve.
Many of the core Quality Control metrics defined above rely on manual tools and methods and are often time consuming, destructive and error prone. But as automation and AI technology is applied to QC processes, some new, less subjective and less destructive tools have become more popular.
Near-Infrared (NIR) testing and the specialized DA meter are newer technology in fresh produce quality control. They use non-destructive quality control methods, making them an attractive option for in field and higher speed testing. NIR spectroscopy quantifies multiple internal properties simultaneously, such as Brix (soluble sugars), dry matter, and organic acids, by analyzing how the produce absorbs specific wavelengths of light.
The DA meter is a specific NIR tool that measures chlorophyll content using the Index of Absorbance Difference (IAD) to objectively monitor fruit ripeness and maturity. Both offer fast, objective results about fruit maturity and quality that reduce waste, enabling efficient sampling and ensuring consistency across the supply chain.
Portable AI-driven Quality Control (QC) tools are becoming more popular as the technolgy driving them becomes more accurate. These solutions leverage computer vision and machine learning (AI) on handheld devices (like smartphones or tablets) to provide instant, objective, and consistent analysis of produce quality, often working directly in the field, packhouse, or receiving dock without requiring constant internet connectivity. The core process involves an inspector taking a photo of a sample (e.g., a bin of apples or a box of tomatoes); the device's AI model then instantly analyzes external attributes like size and color distribution.
The shift to these digital, portable tools delivers several key benefits for quality control and the overall supply chain. First, they dramatically standardize grading, removing the inherent bias and inconsistency that comes with human fatigue or varied training across inspectors and global sites.
Second, they provide real-time, actionable data on product quality and quantity, which helps decision-makers make crucial, timely choices, such as prioritizing which bins to ship first, optimizing storage locations, or setting appropriate prices. Verified, timestamped digital documentation of the produce's condition at the source helps to minimize costly disputes and rejection rates between exporters and importers, turning quality control from a reactive process into a proactive, transparent system that ultimately reduces food waste and maximizes profitability.
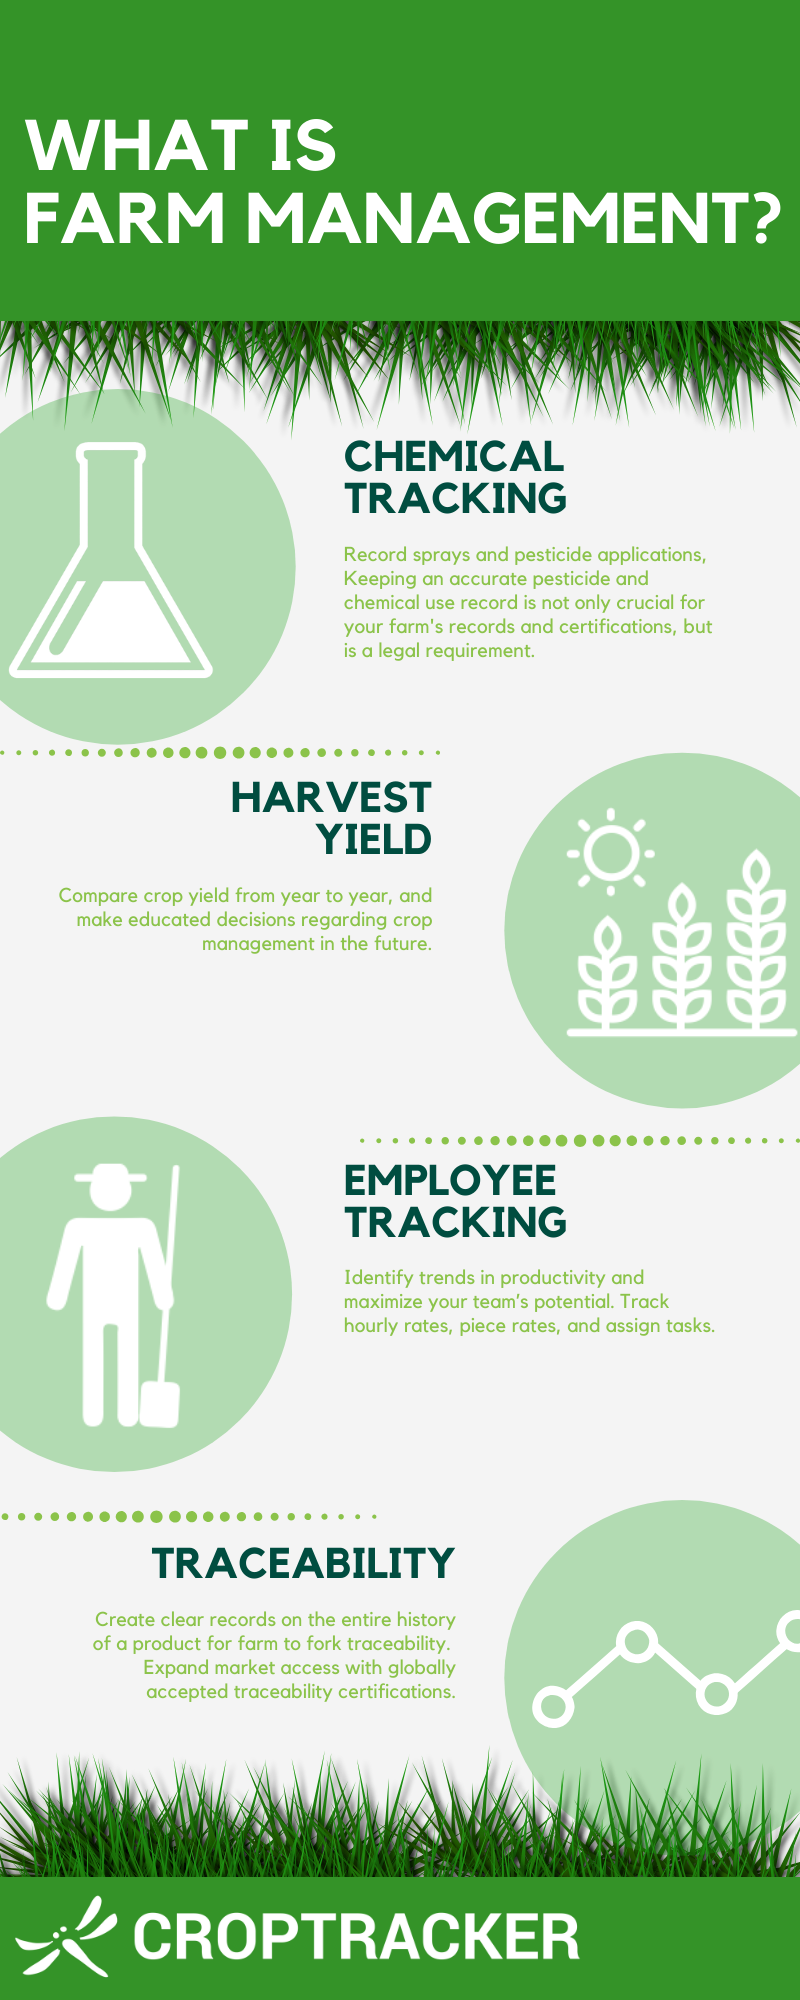
Farm management is an umbrella term, covering a wide range of topics associated with running and maintaining a successful agricultural operation. Decision making, implementation, long term business strategy, sustainability, leadership, and organization management make up a large part of farm management, but the daily operations of running a farm like production practice activities, managing employees, applying pesticides, and harvest inventory tracking, make up a large component as well. Farm management’s goal, then, is to maximize production and profit in a given farming operation.
Business management is just one aspect of farm management, and a strong farm management strategy will include a business plan that takes into account the long term goals and risks related to your organization. A quality business plan should include a vision, mission, and a detailed breakdown of the resources needed to meet your goals.
Farm management companies may offer consulting services, site assessments, and even on site training to help growers improve their farm management strategies. Such strategies range from employee leadership training, to more traditional cost benefit analysis to maximize profit.
While there exist a variety of courses and training programs for farm management, many growers opt instead to invest in farm management software systems that can help them to collect data and track the metrics they need. Farm or agriculture management software are digital tools that help growers centralize their records, improve their productivity, and make better decisions for their farms. High quality farm management software will allow growers to better record, monitor, and view data in meaningful formats, and should provide users with farm analytics and reports at various stages of production.
Farm management has become more and more data centered, and being able to understand your data is just as important as having it recorded. Consolidating data into reports, creating long term plans based on trends in yield and revenue, and having data ready and available at audit time are all crucial aspects of a farm management strategy.
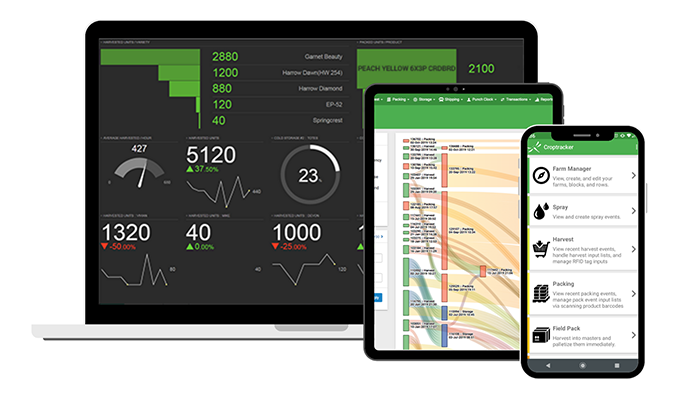
Don’t know how to get started? Croptracker is a farm management software system that is easy to use, scales with your business, and enhances traceability and record keeping for growers of all kinds.
Interested in learning more about Croptracker? Learn more about our Farm Management Software, or book a demonstration to schedule a meeting with our product experts.
And as always, if you're ever stuck, never hesitate to e-mail us at support@croptracker.com or Live Chat with us by clicking the green speech bubble ![]() in your bottom right-hand corner. We're always happy to help, so Croptracker can make your farm more efficient, safer, and more profitable!
in your bottom right-hand corner. We're always happy to help, so Croptracker can make your farm more efficient, safer, and more profitable!
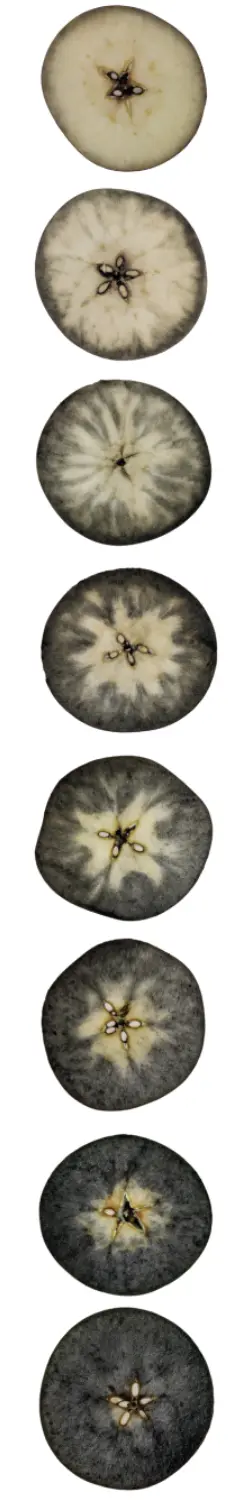
Starch is a type of carbohydrate that is found in many plants, including fruits such as apples. In unripe apples, starch is the primary form of carbohydrate present, but as the fruit ripens, the starch is converted to sugar. The amount of starch present in an apple is one metric used to determine its level of ripeness, with more starch indicating that the fruit is less ripe.
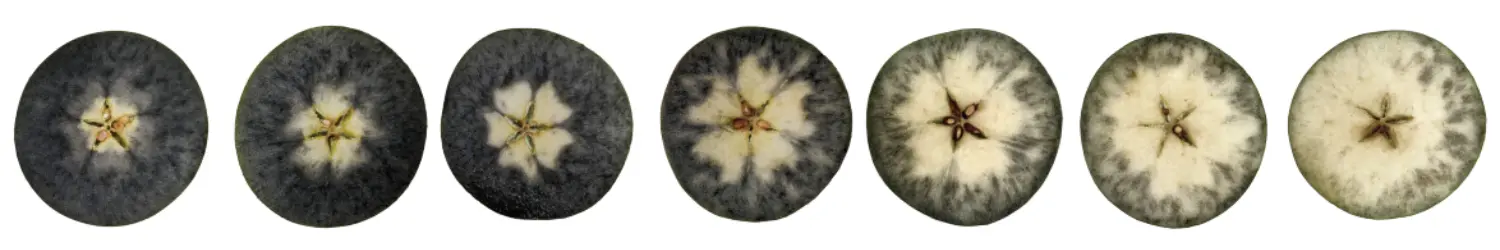
The starch test used in apple harvesting is based on the principle that iodine reacts with starch to produce a blue-black color. By applying an iodine solution to a cut surface of an apple, the amount of starch present can be determined by the staining pattern of the color produced. Different apple varieties may require different levels of staining to indicate the appropriate level of ripeness, so it is important to use the appropriate chart for each variety.
Along with firmness, size, background and red coloration, and brix, the starch-iodine test is one of the main preharvest tests apple growers use to determine the ideal harvest window. A Starch Pattern Index (SPI) is a visual tool used to estimate the starch levels in the fruit using an iodine solution. To determine the ideal window, testing for starch levels should begin at least four weeks before the expected harvest date, and additional tests should be done at least once each week until the optimum harvest window is determined.
Starch testing is also a key step in organizing storage inventory on harvested apples. After a certain maturity level has been reached in harvested fruit, it is no longer viable for long-term storage. Apple storage and packing facilities that sell fruit from outside growers will test starch levels at receiving locations as part of their QC processes. Fruit with like starch levels will be grouped and stored together for packing later in the season.
Always follow the label instructions and wear appropriate personal protective equipment when handling and mixing chemicals. Avoid contact with eyes and skin, and wear gloves when preparing the iodine solution.
Warning. Iodine is a poisonous chemical. This iodine solution should be correctly labeled and kept away from children and pets. Consider treated apples poisonous and do not feed to any animal or use in composting.
Use a fresh batch of solution and apples that have been recently harvested. If the temperature of the apples, or of the iodine solution, is less than 10°C, inaccurate readings may result.
There are various instruction sets from governmental and academic institutions we used to compile these instructions including Virginia Cooperative Extension, Michigan State University, and the government of Ontario.
While the testing process remains the generally the same across the board, there are several scales used around the world to assess the results. Some scales are variety specific and some are general and meant to be applied accross multiple varieties.
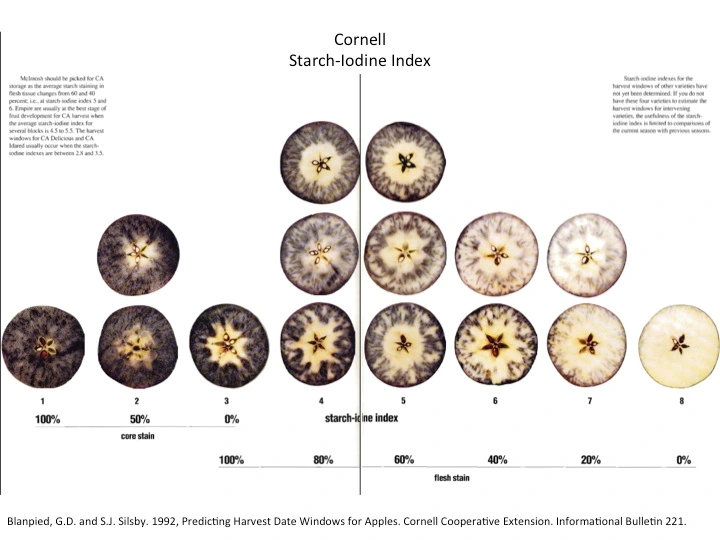
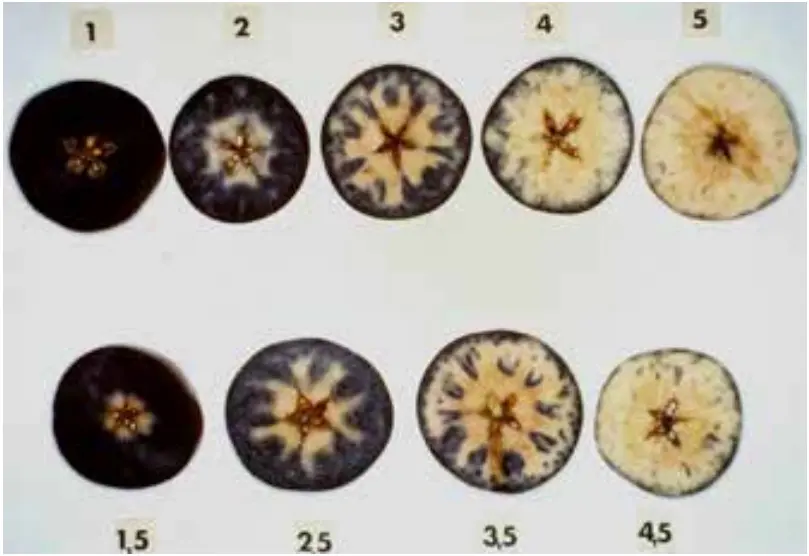
The Cornell starch-iodine scale is scored out of 8 with one being the darkest stain, and therefore most starchy and least ripe, and eight representing the lightest, most ripe apples. This chart is favoured by many growers because it can be consitently applied across many varieties. It is also the most widely cited scale in studies about breeding, long term storage and harvest timing. Because of the varietal consistently and extensive testing, the Cornell scale is the scoring system used in Croptracker’s Starch Quality Vision system.
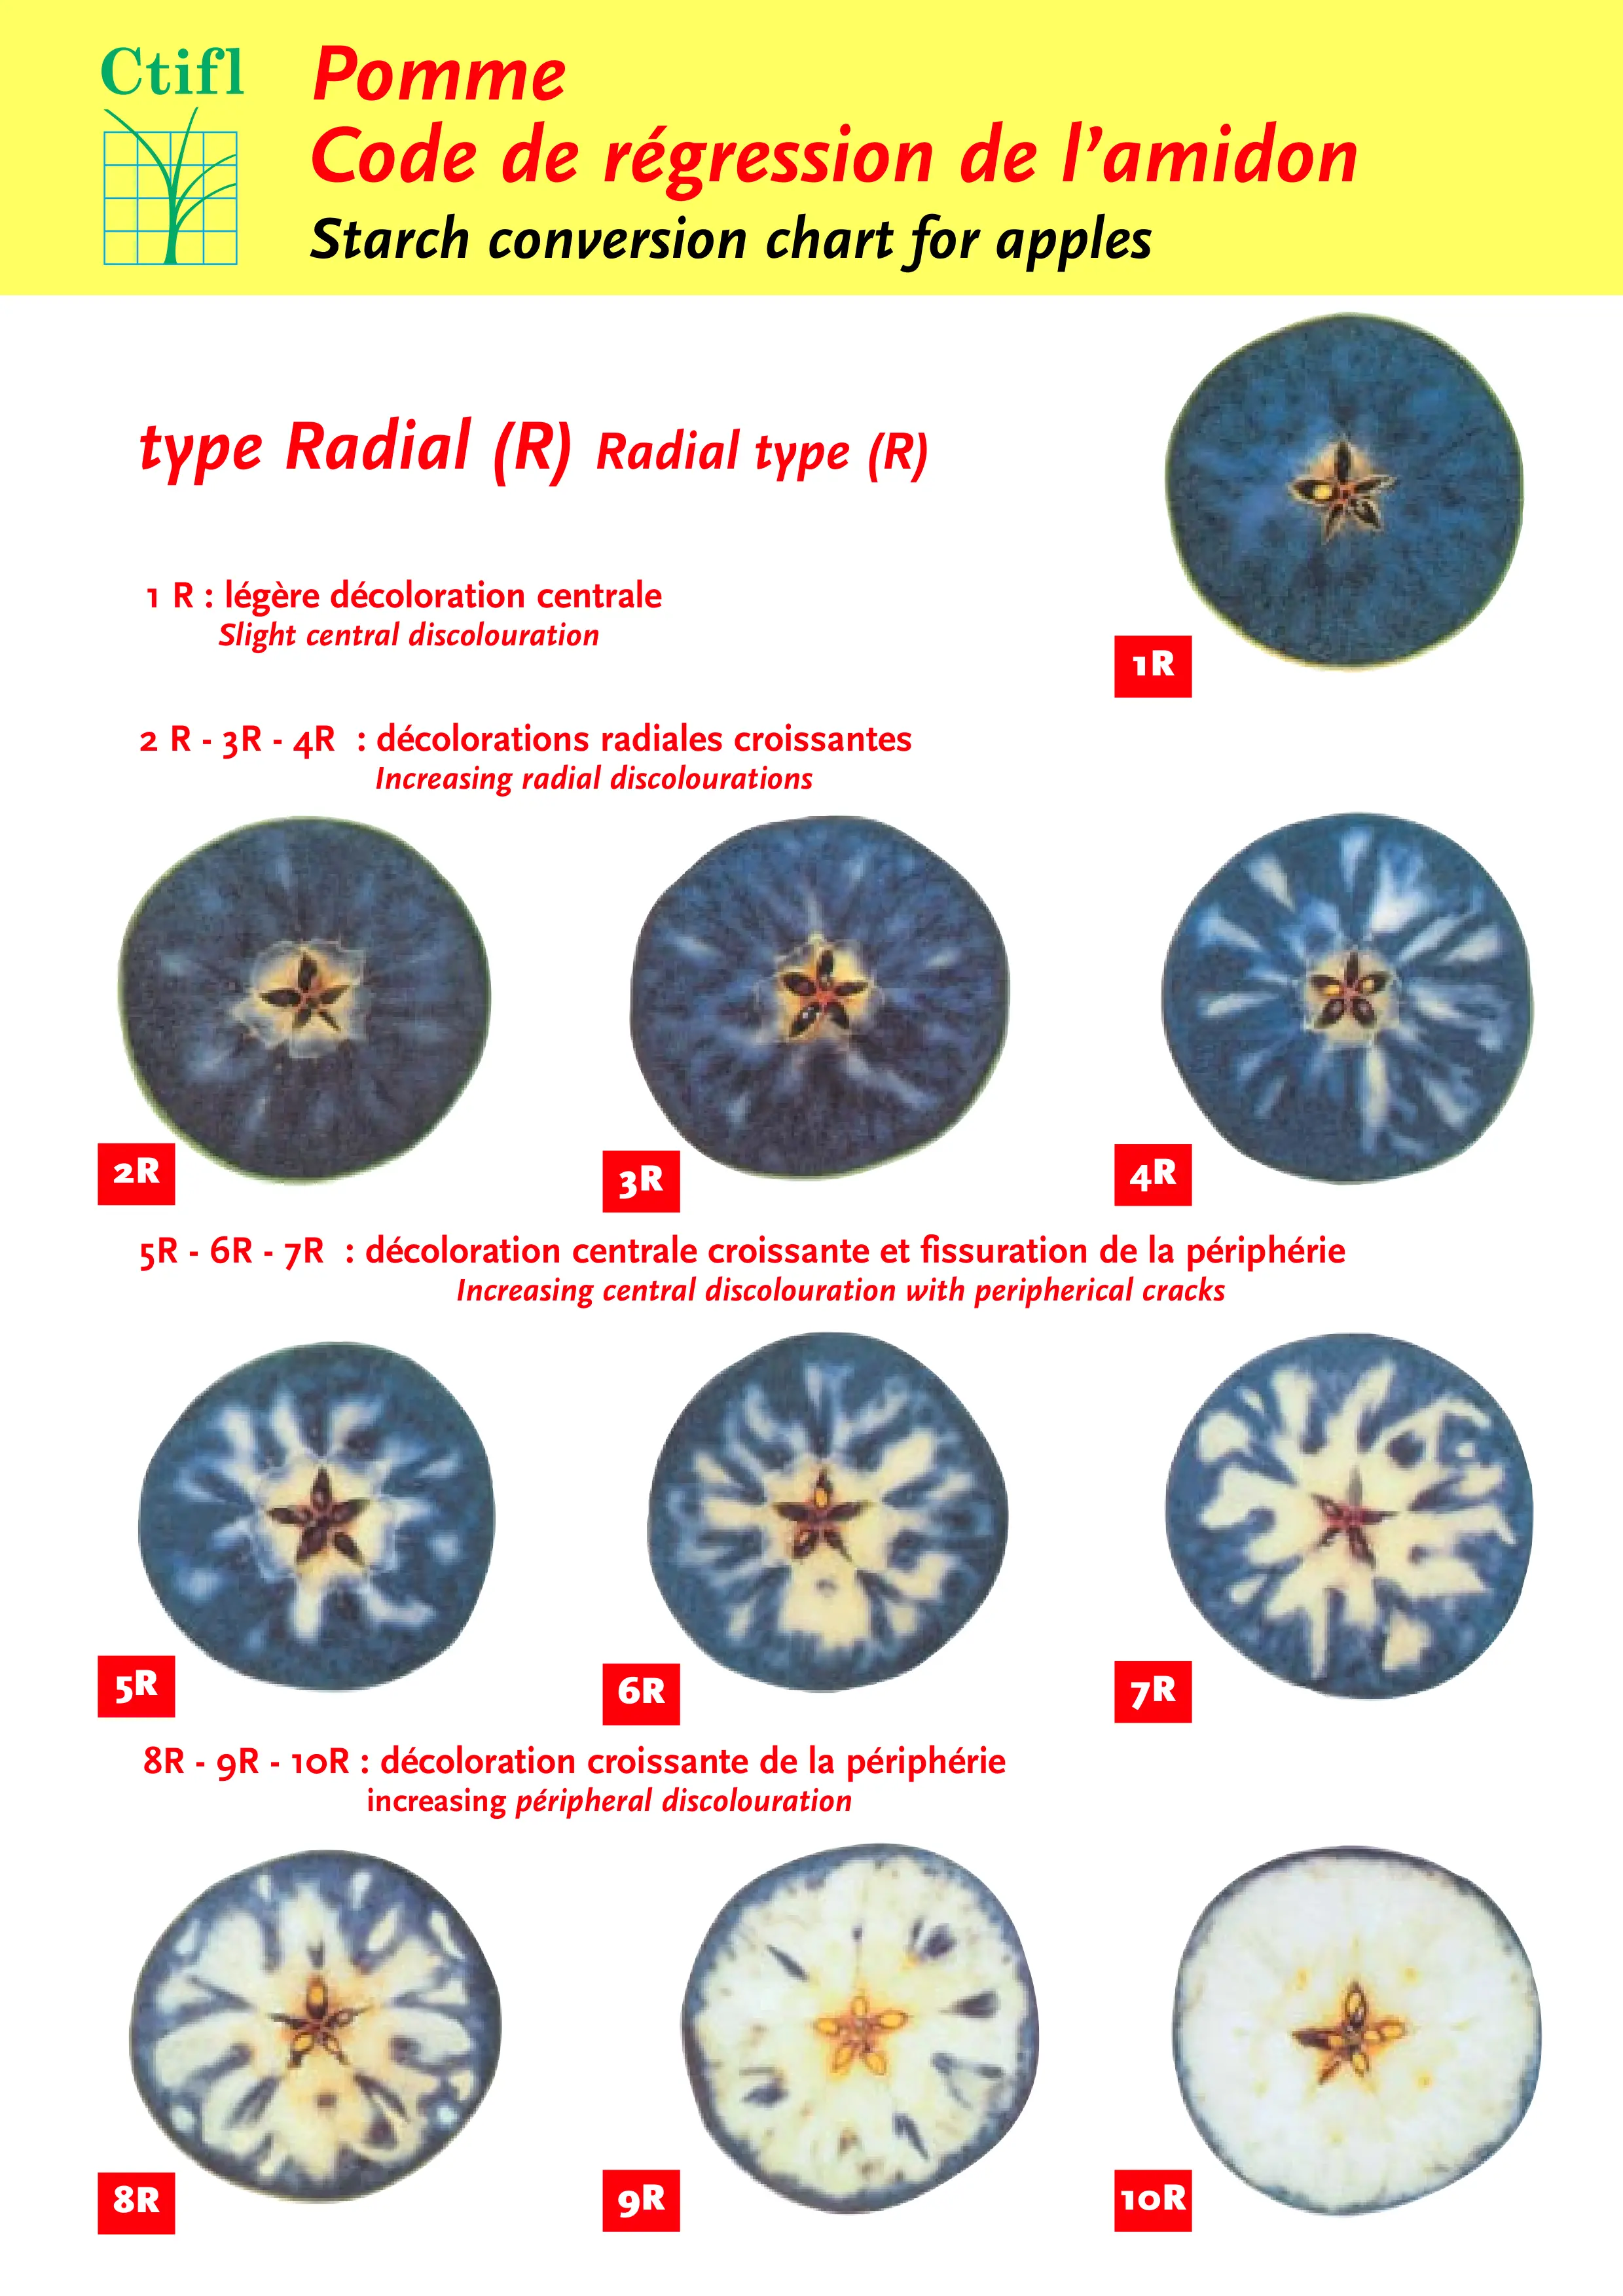
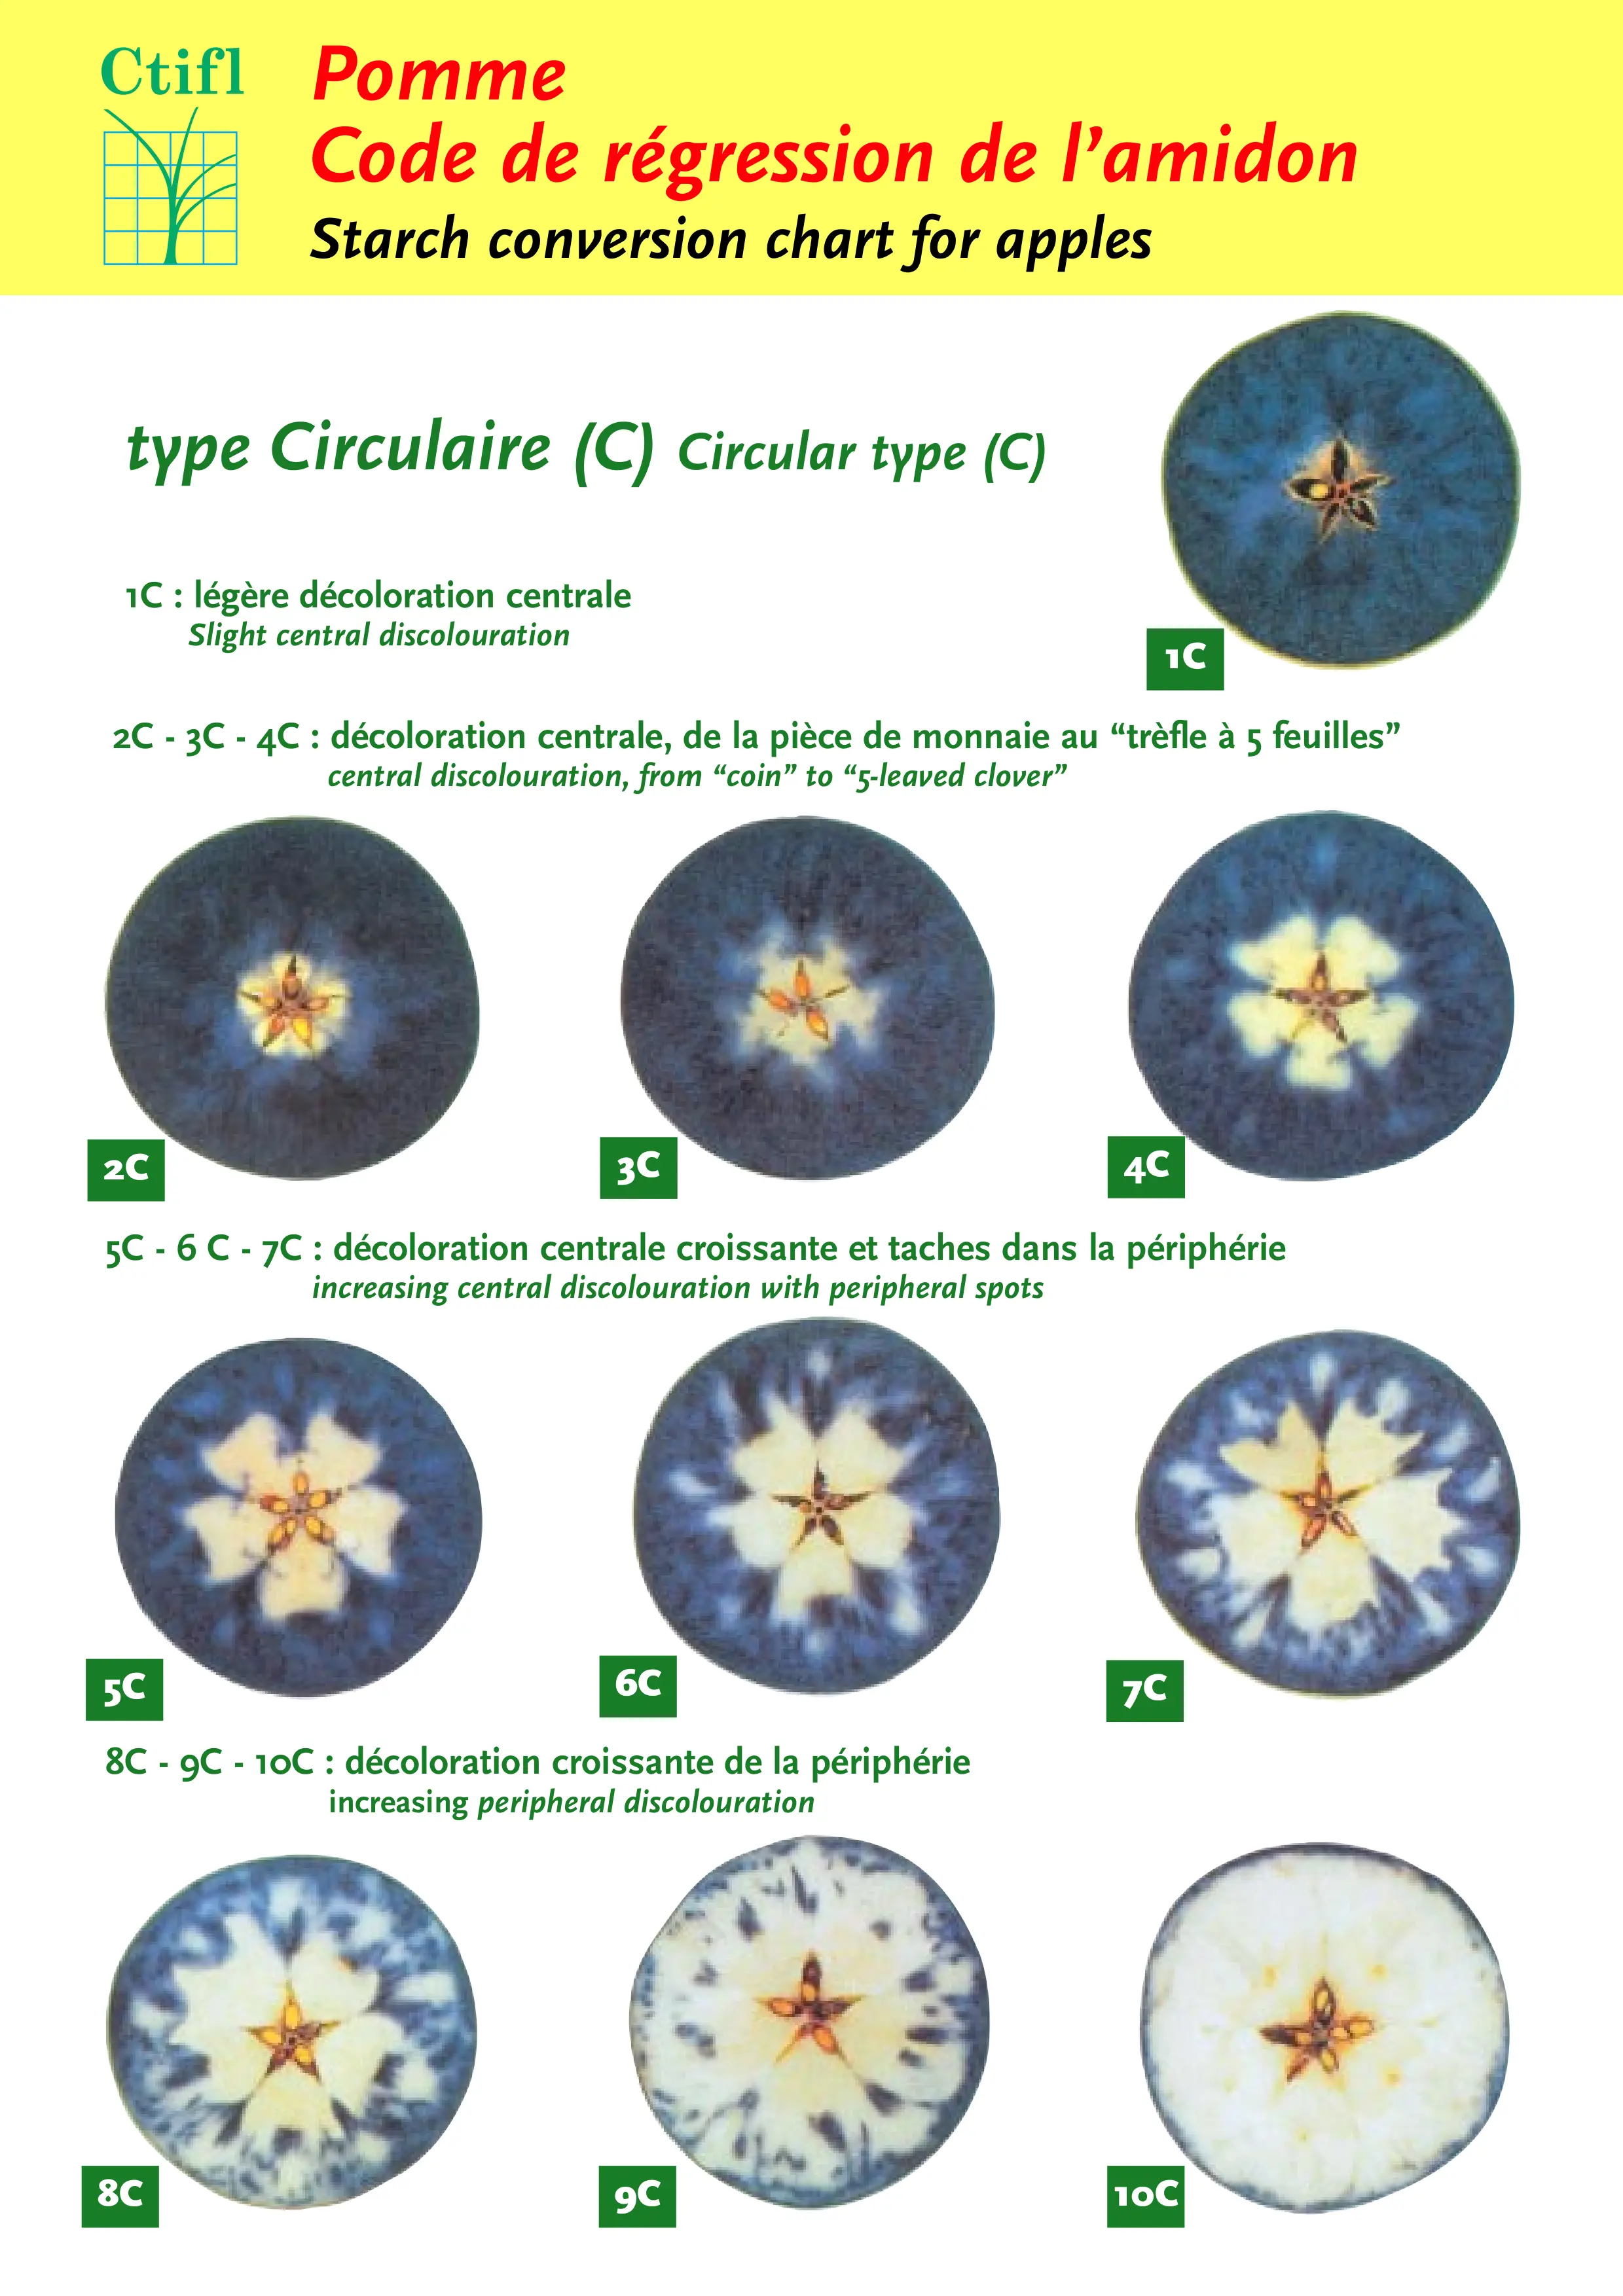
The CTIFL scale was developed in France with an emphasis on European cultivars specifically. It is often the scale used in harvest and storage reference guides for the Pink Lady/Cripps Pink variety. This chart uses the classic 10-stage scale and includes harvest window recommendations for several popular European varieties. The CTIFL starch scale system recognizes two staining patterns, the circular staining pattern, and the radial pattern which are applied to specific varities based on their common starch patterning.
The Laimburg scale is a 1.0 - 5.0 ranking to one decimal place used almost exclusively in European regions around Germany, Austria and Northern Italy and was developed by the Laimburg Research Centre. The scoring key also includes examples of the halfway point between the 1-5 scores. In these regions, the score is often converted to a ten-point scale after grading for use in the Streif Index Method, which uses both pressure and brix as well as starch to calculate apple maturity.
Not strictly speaking an SPI, the Streif index is calculated from the results of three quality control tests; a starch test, a pressure test, and a test of soluble solids concentration, or Brix. The Streif Index is meant to be a more thorough and accurate measure of maturity than using starch alone. Lower values mean the fruit is closer to maturity, and the Streif Index is particularly valuable not just as a tool to determine the start of harvest, but to determine the last possible date.
The equation F/(SSC x S) where F = Flesh firmness, SSC = Soluble Solids Concentration and S = Starch test results provides the Streif coefficient, which is then compared to the ideal values of individual varieties and regions.

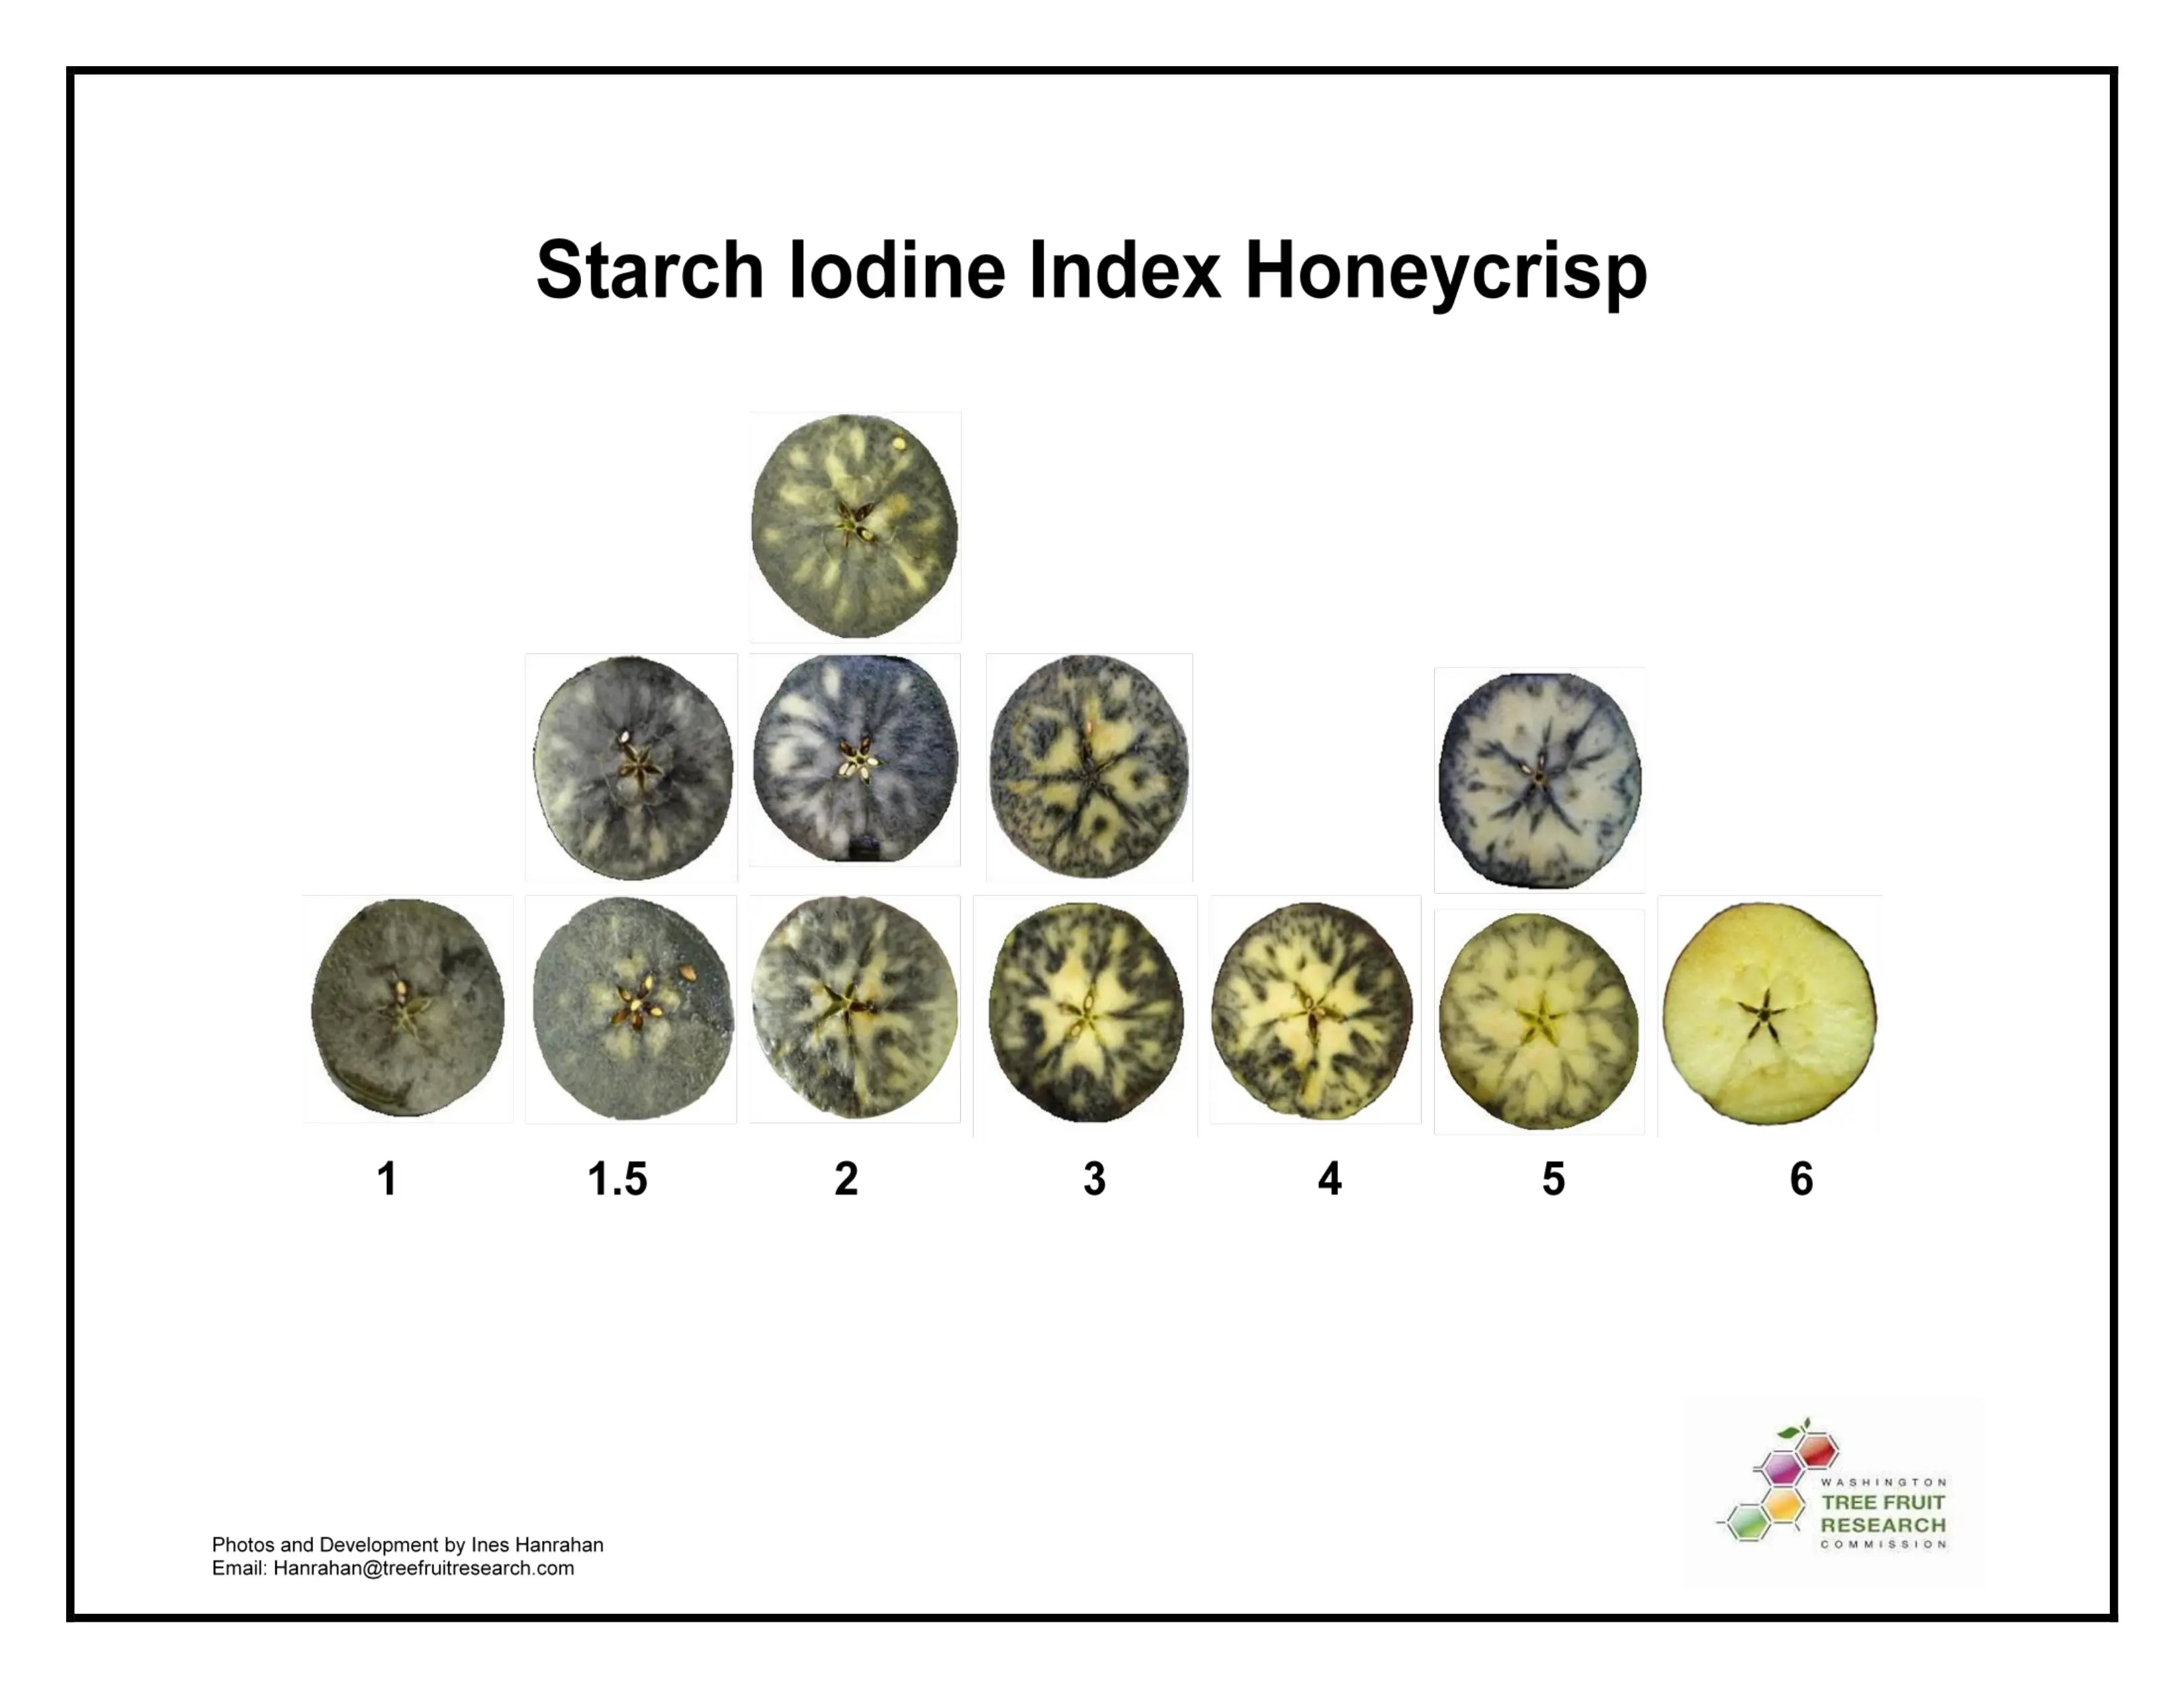
The ever-popular Honeycrisp apple is a sensitive cultivar with very specific storage requirements. The Washington State Tree Fruit Research Commission has created a specific Honeycrisp starch index for these finicky apples, which stain in patterns inconsistent with the other varieties and starch scales.
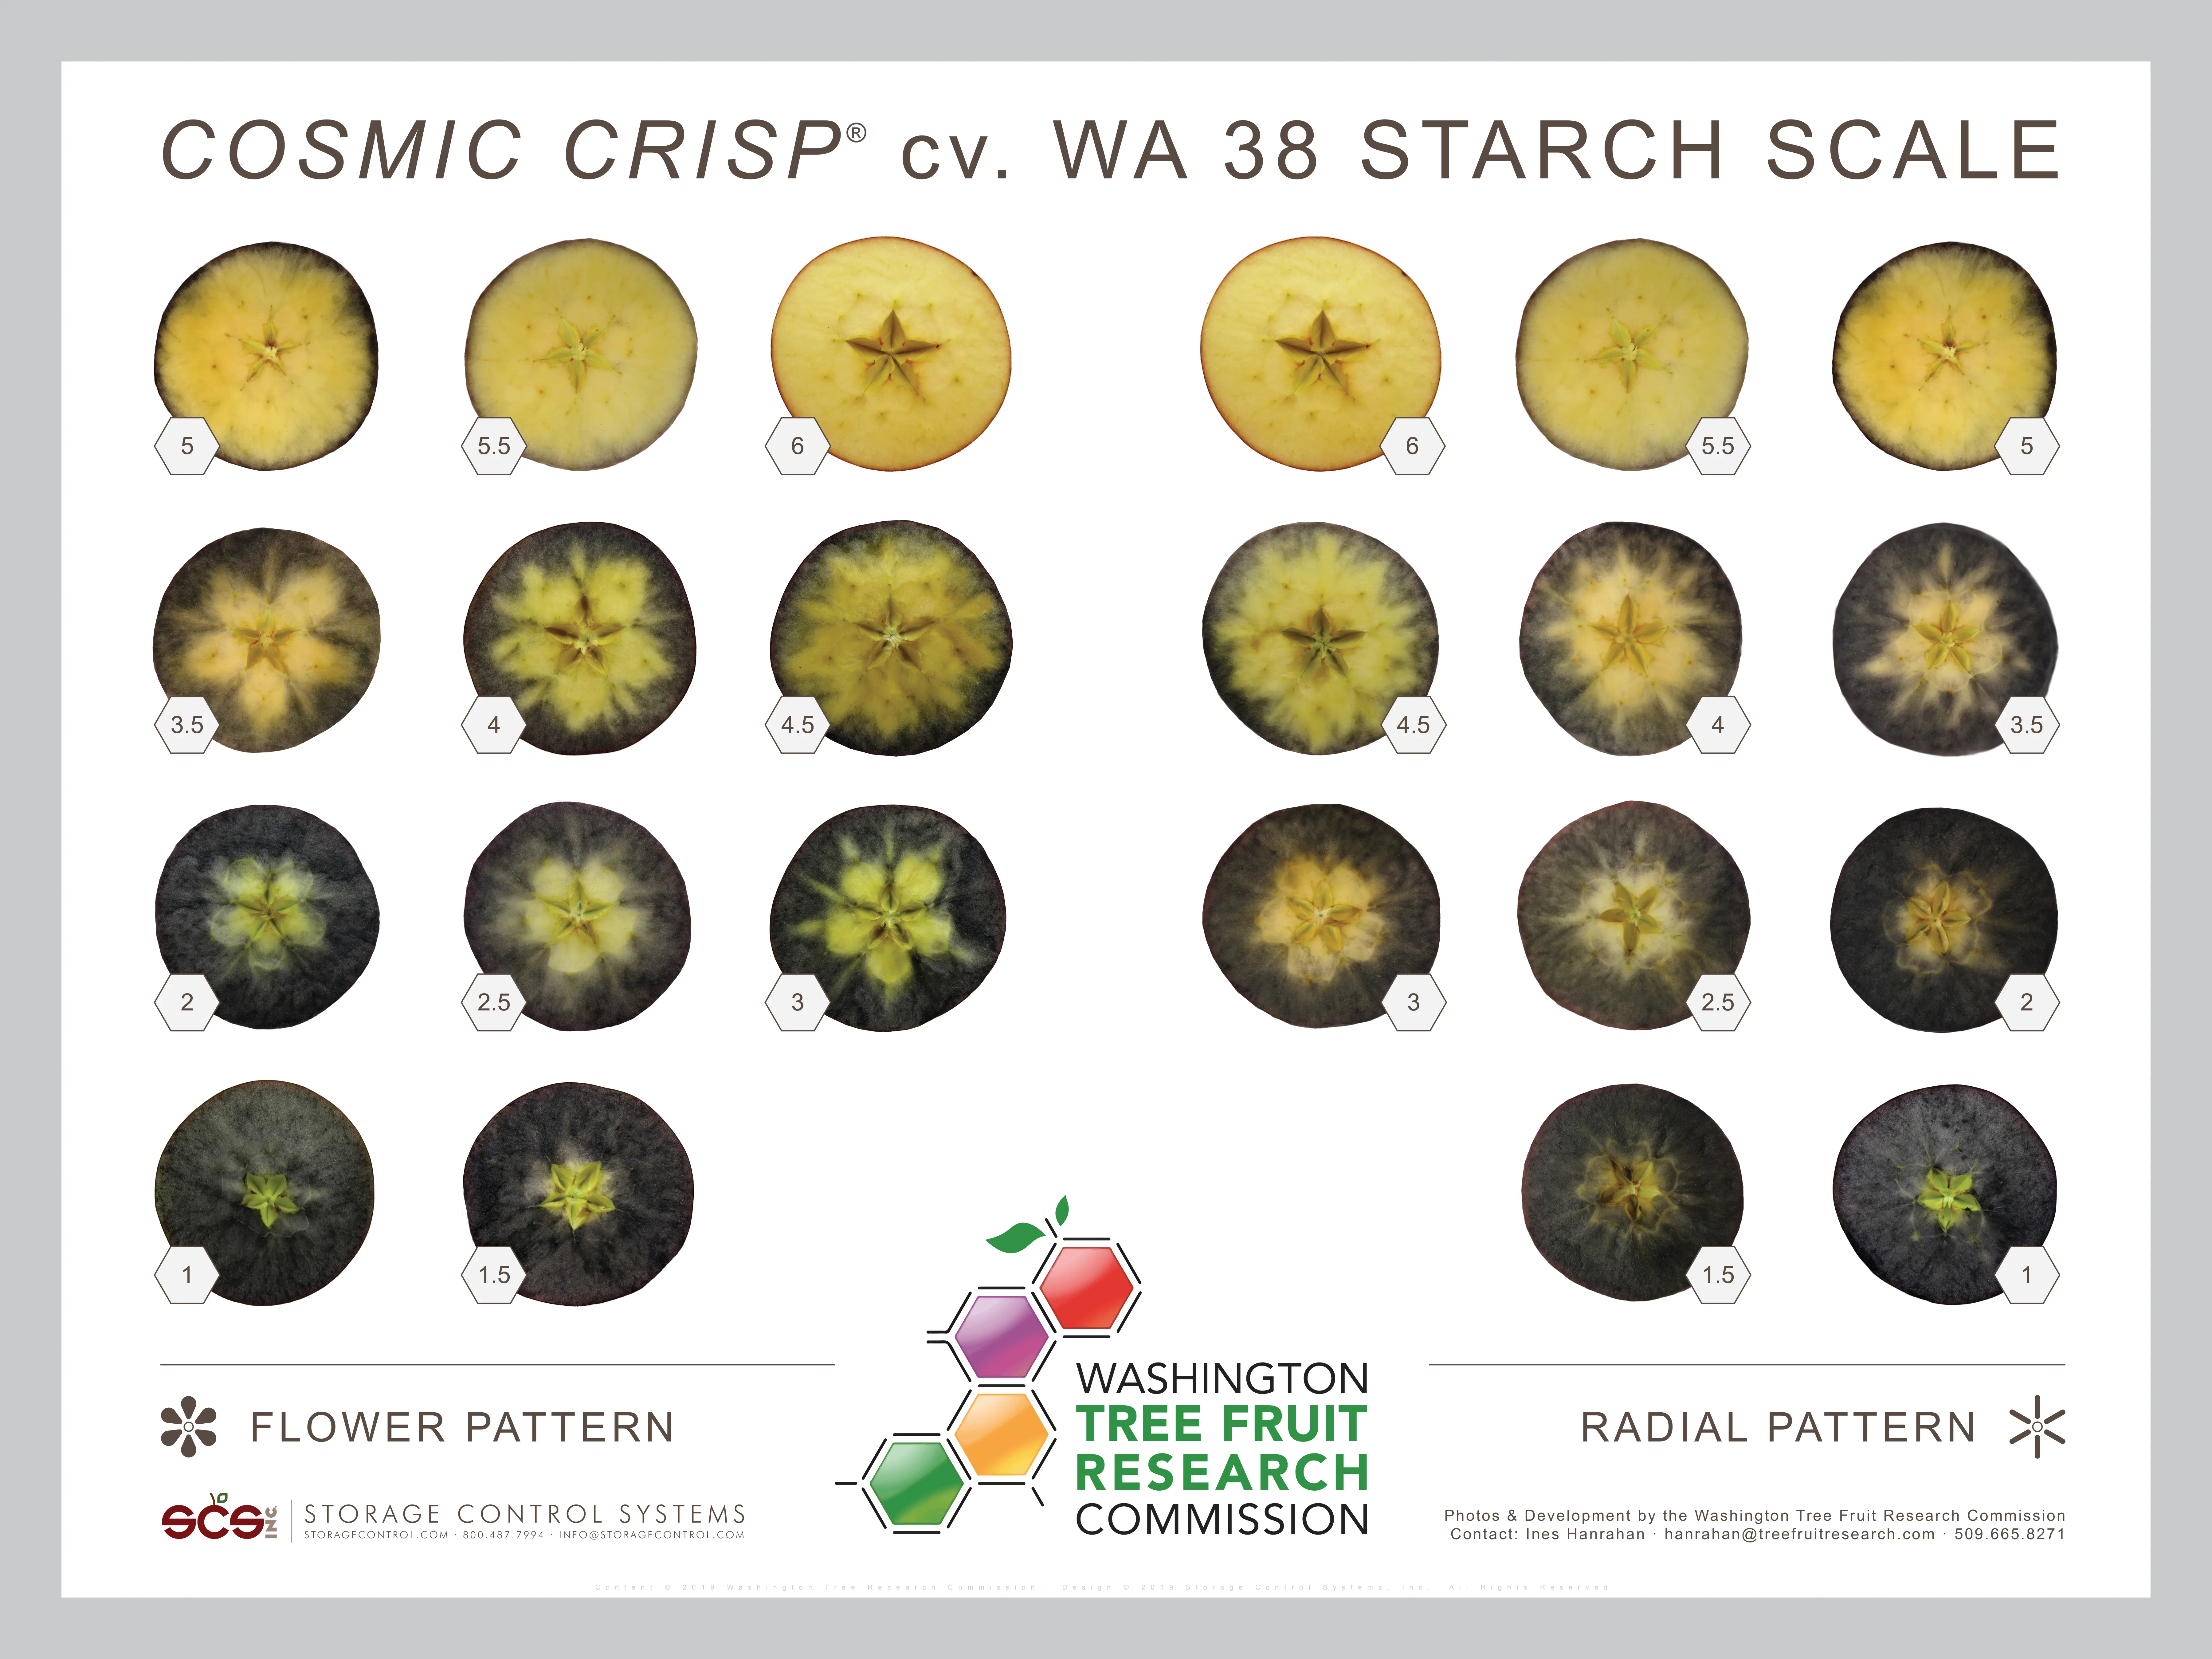
The WA38 Cosmic Crisp scale is a cultivar-specific scale designed for the unique staining pattern that occurs in cosmic crisp apples. This scale is out of six with a 0.5 interval and has two staining patterns to account for variability. There are extensive resources about growing Cosmic Crisp from the Washington Tree Fruit Research Commission to ensure the branded and IP-protected variety is consistent across growers, packers and markets.
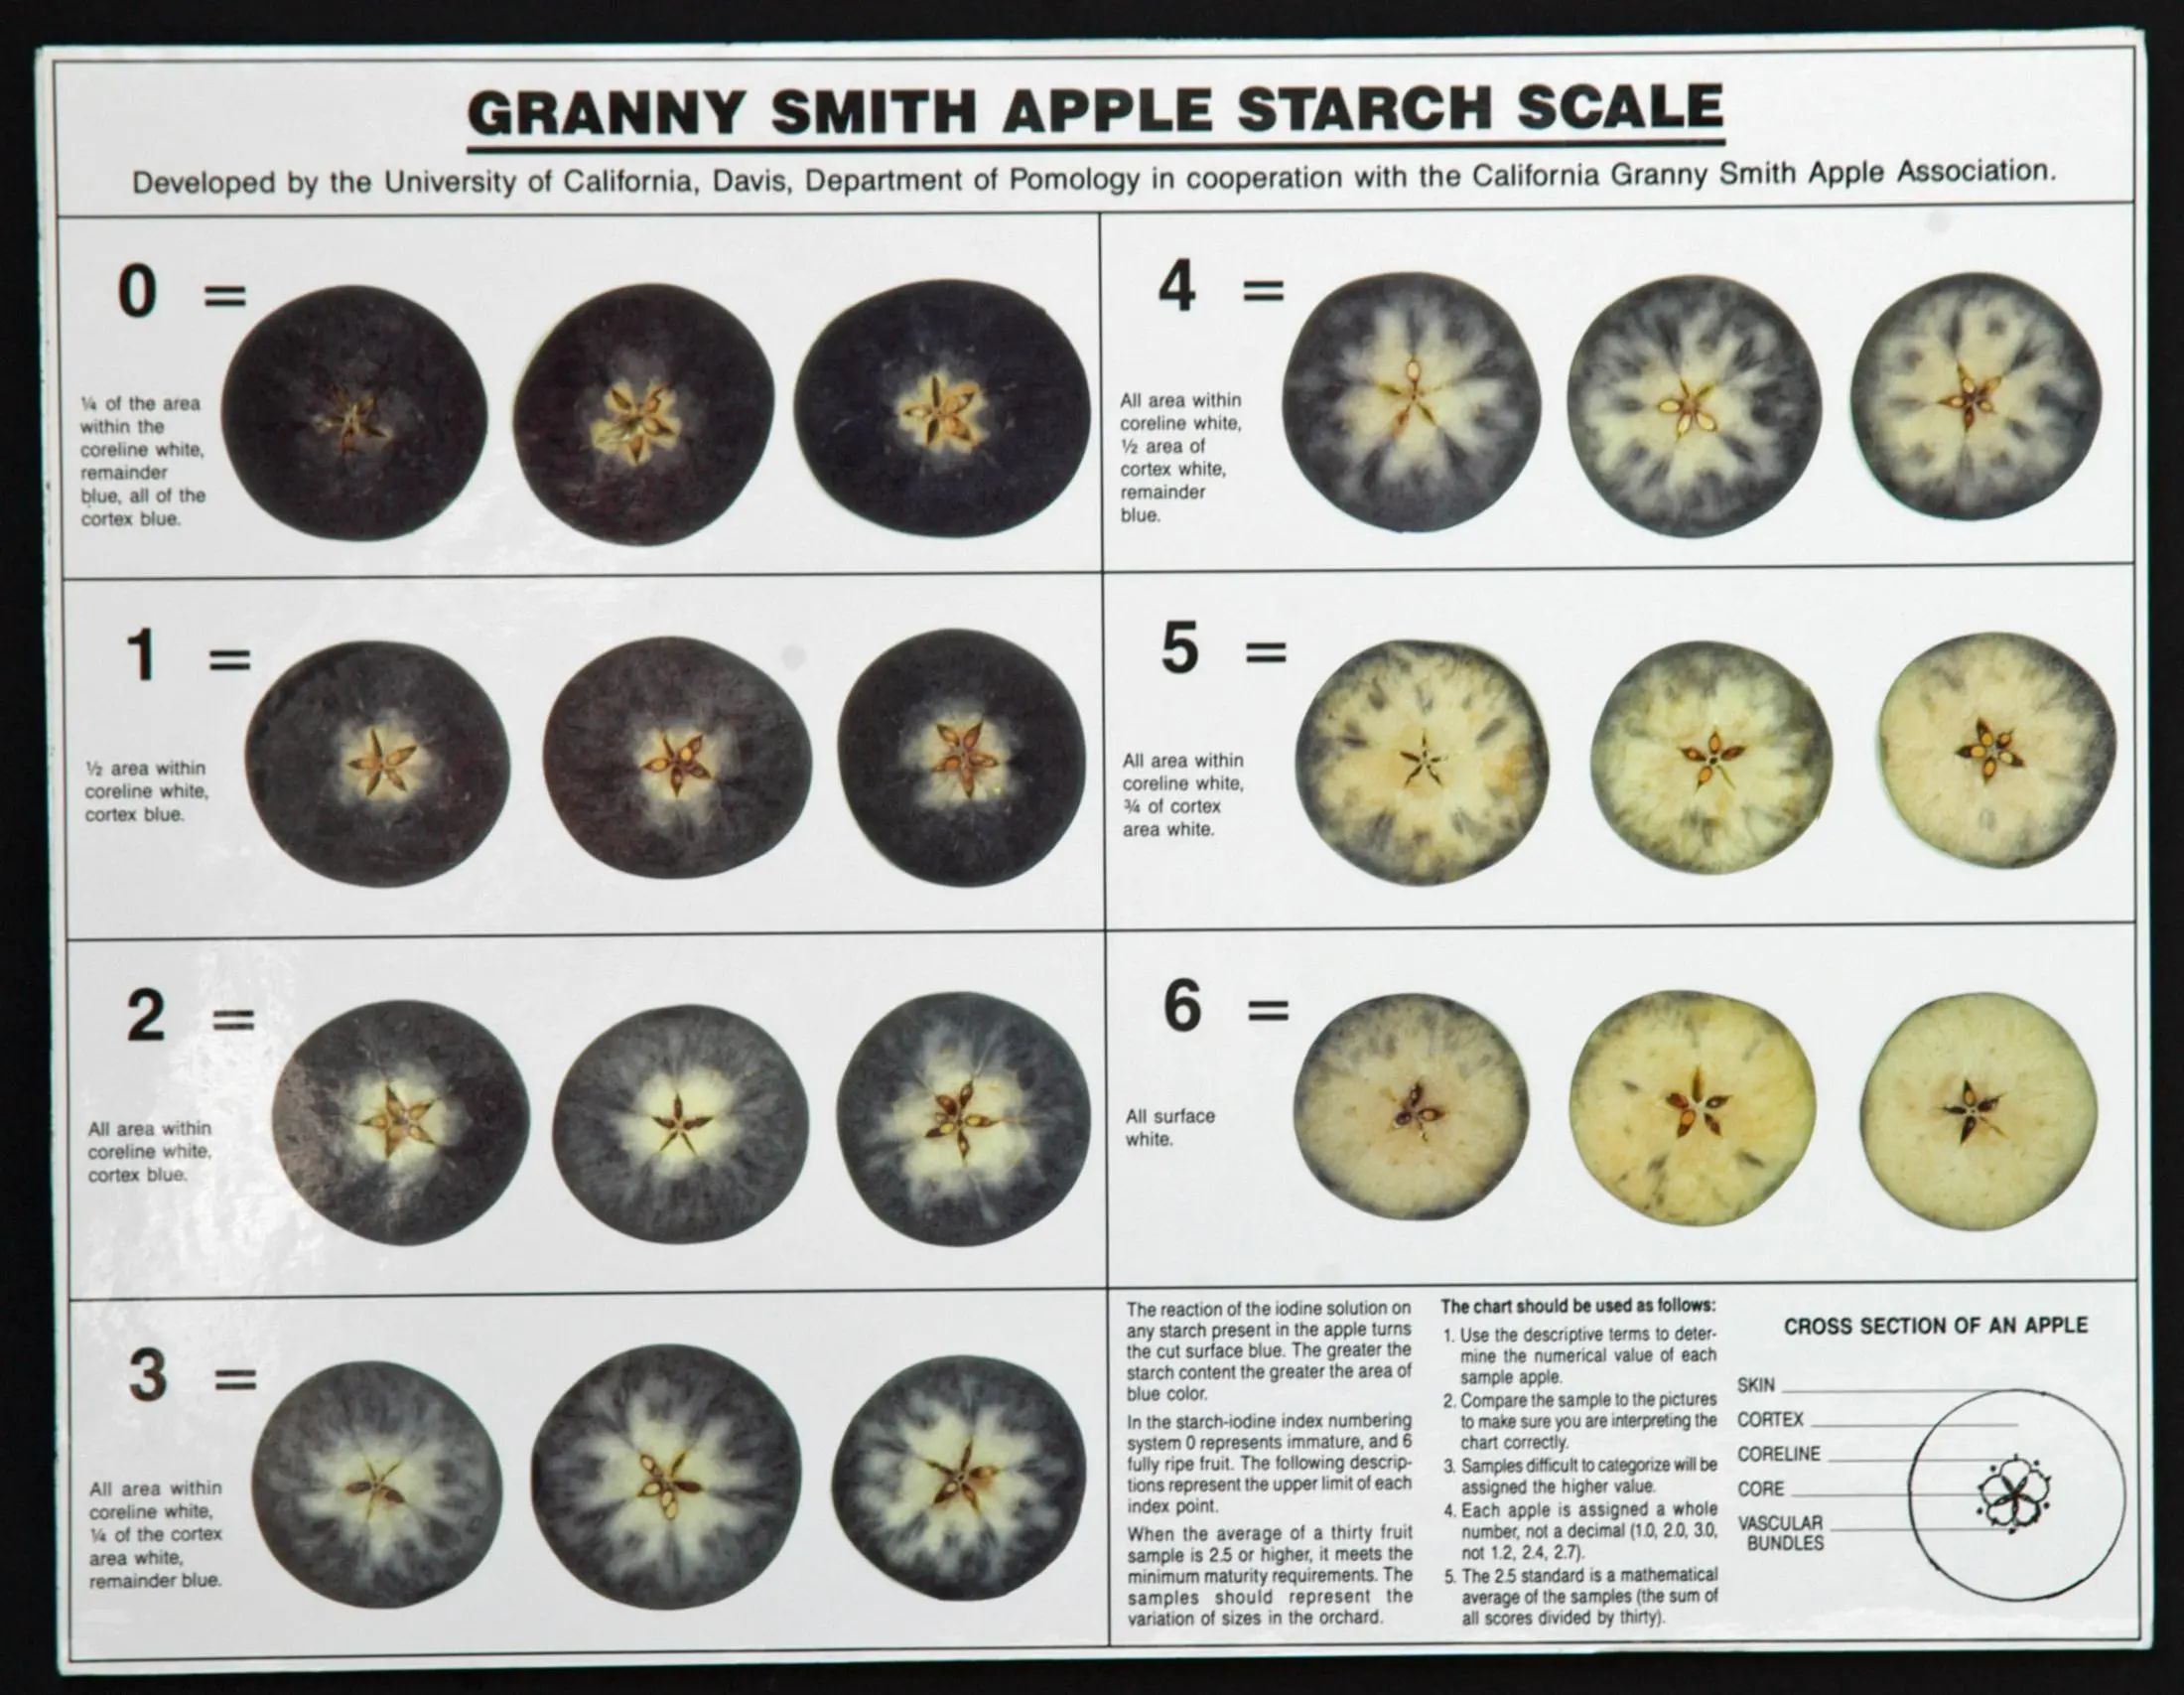
The Granny Smith scale was developed by the University of Southern California Davis Department of Pomology in cooperation with the California Granny Smith Apple Association (now known as the California Apple Commission). It is a scale from 1 to 6 with only whole numbers applied to individual scoring. It prompts testers to pay attention to key indicators in all regions of the apple cross-section, the skin, cortex, coreline, core and vascular bundles.
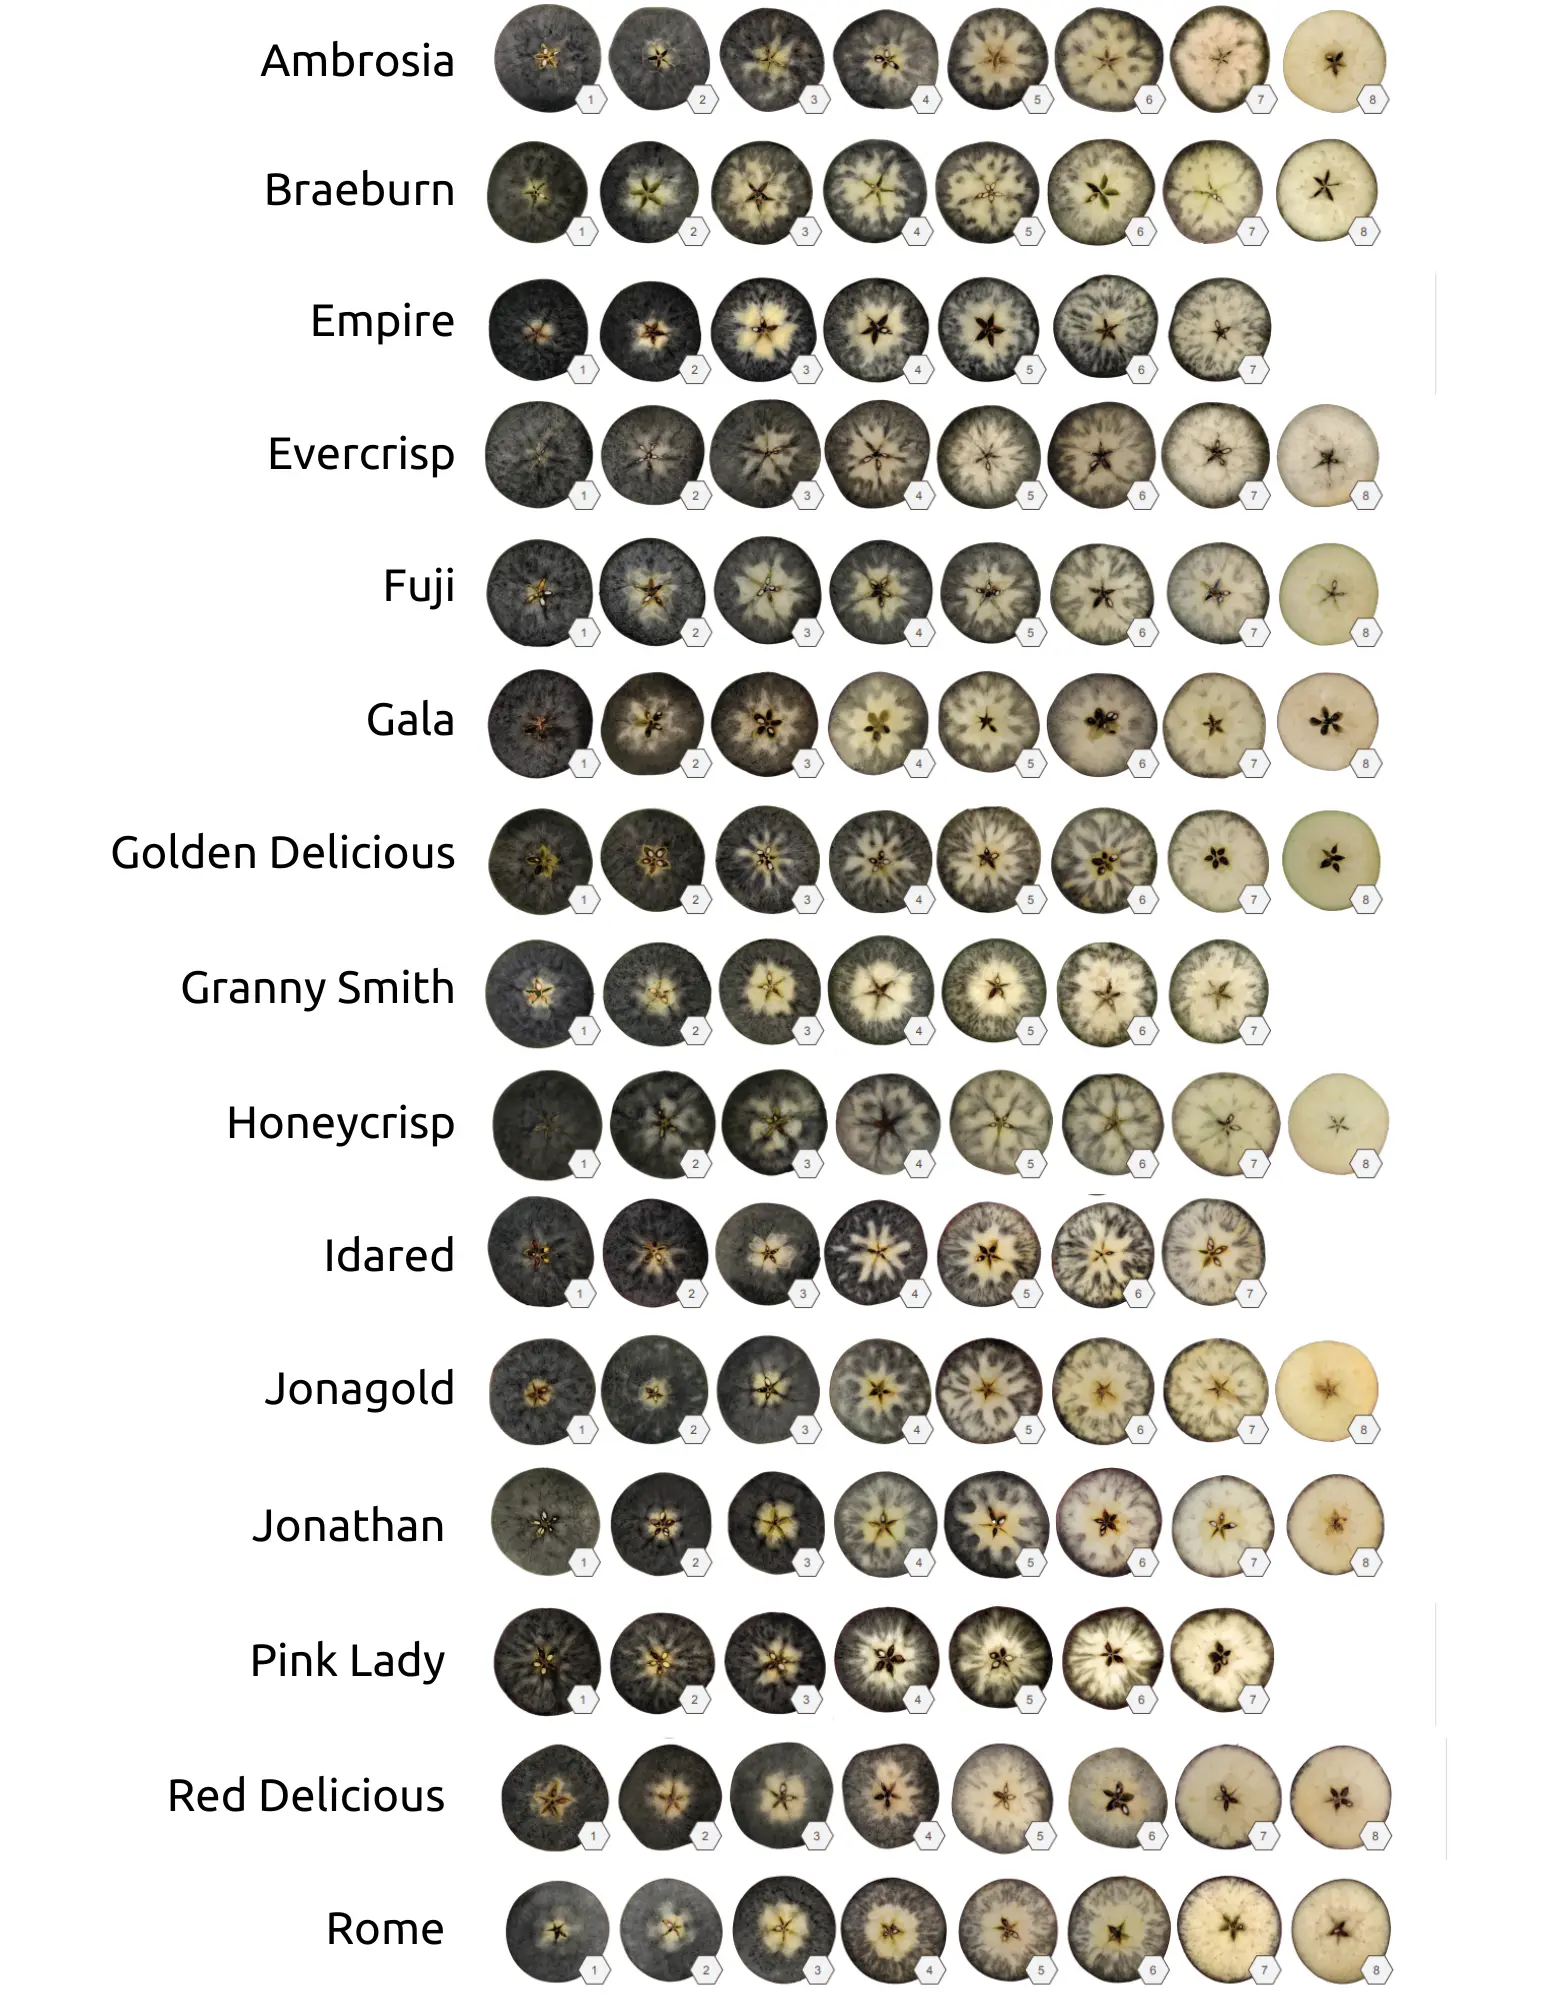
The Michigan State University Apple Maturity Program has perhaps one of the most complete and varietal-specific starch index scale guidelines. Their index contains specific scale references for the main commercial varieties in Michigan, including Ambrosia, Braeburn, Empire, Evercrisp, Fuji, Gala, Golden Delicious, Granny Smith, Honeycrisp, Idared, Jonagold, Jonathan, Pink Lady, Red Delicious, and Rome. The scales go from 1-7 or 1-8 depending on the variety and this guide contains recommended storage ranges for short and long-term storage. The 1-8 range aligns closely with the Cornell scale making it useful in comparisons to research done using the Cornell scale.
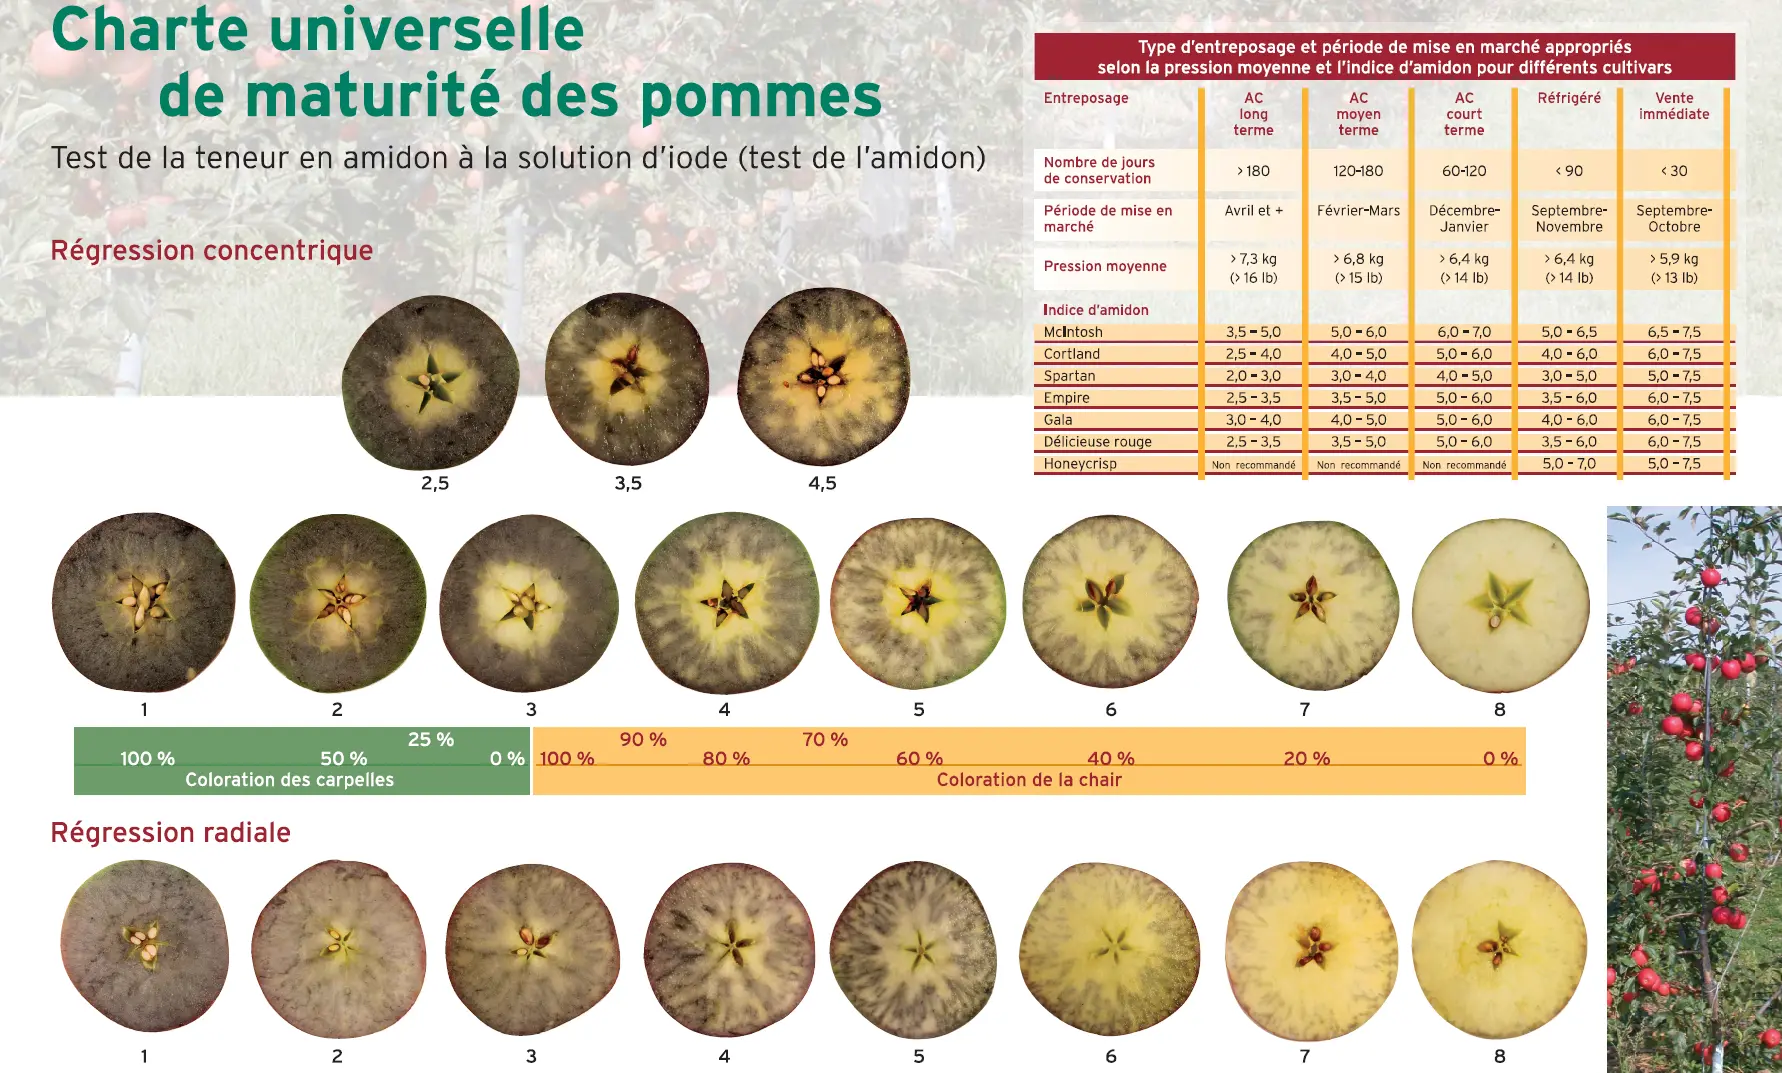
Developed in conjunction with Les Producteurs de pommes du Québec (Quebec Apple Growers Federation), the Quebec Agriculture and Agri-Food Reference Center and Engage Agro, this scale covers several varieties and is especially useful as it also includes storage guidelines. The table in the top right corner shows the starch and pressure ranges needed for each variety to quality for long-term, medium-term, and short-term CA storage and for cold storage and immediate sale. Similar to the Cornell scale, the score ranges from 1 to 8 but includes both Radial and Circular (Concentric) pattern examples.
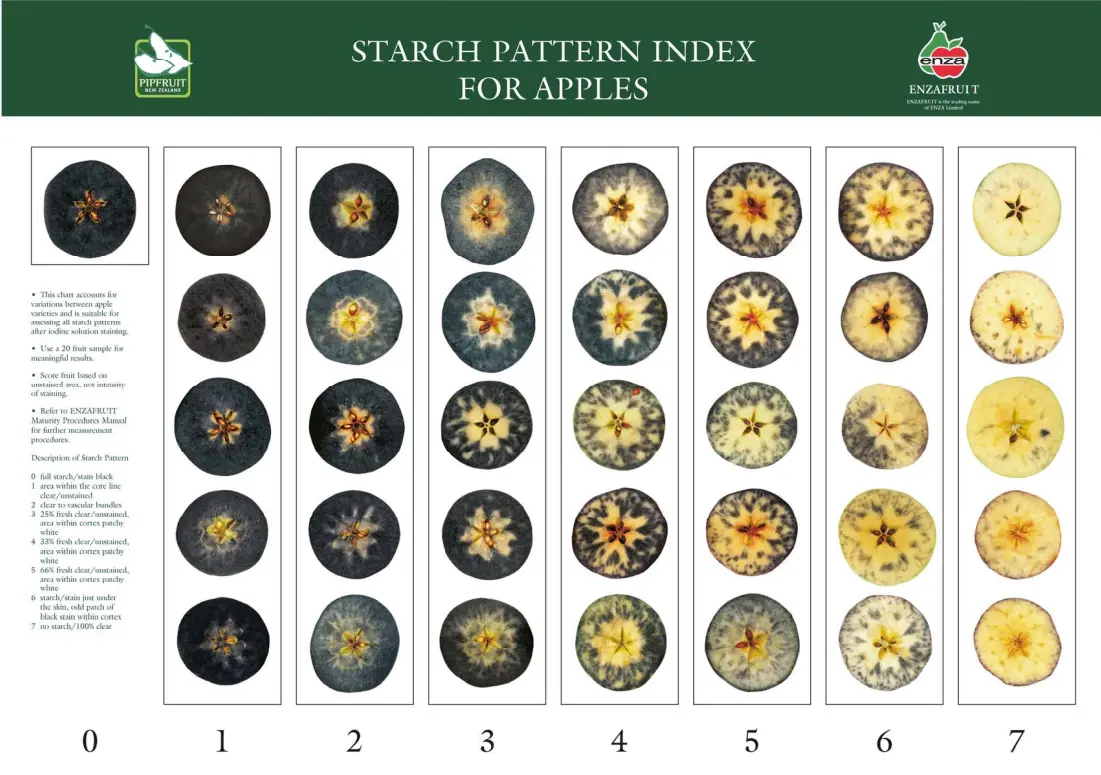
This scale was developed for use primarily in Australia and New Zealand, the ENZARUIT / Pip Fruit New Zealand (New Zealand Apples and Pears). It helpfully includes several examples for each score and ranges from 0 to 7 to accommodate different patterning tendencies. It includes some written descriptions of the size of the table for further clarification on the difference between the ranges and also suggests that growers use at least 20 apples per sample for meaningful results.
With so many variations in Starch Pattern Index scales and guidelines, it can be challenging to develop and maintain industry-level standards for grading. Many organizations develop their standards over the years. Internal guidelines used for their varieties can be a combination of the scales listed above and other regionally developed varietal scales.
Standards are also very difficult to develop in starch testing as the grading process is subjective. Two people using the same scale and looking at the same iodine-stained apple will not necessarily come up with the same score. Lighting, eyesight, and fatigue all play into how an individual assigns a starch score.
Several academic and industry studies have been done to assess the possibility of eliminating subjectivity through digital starch index assessment tools. Most of these tools use black-and-white imagery to determine how much white space vs iodine staining is present and assign a score based on this ratio. This method however fails to take into account the pattern variation that can impact a score significantly.
Croptracker’s Starch Quality Vision system uses pattern, color and stain ratio recognition to classify and score images in the app of iodine-tested apples on the Cornell scale. For more information on digital starch grading, check out the Starch Quality Vision page.
Detailed farm record keeping is crucial when making important business or planning decisions for your operation. Not only is it a poor business practice to not keep records of farming activities, but it can be illegal not to keep your records in order.
Farm records can include any of the following: expenses, labor, chemical/pesticide tracking, harvest and yield records, planting records, shipping records, FSMA and GlobalGAP compliance records, and more.
Traceability plays a huge role in practicing safe farming, as it is always important to be able to look back and see the full history of product, from planting to shipping. Keeping your records in good order will vastly simplify this process, and make auditing season a breeze.
At a minimum, growers must keep records to comply with legal requirements for taxes and restricted chemical use applications, but additional record keeping is a valuable tool. Many growers track their expenses, from equipment runtime, to labor costs, to chemical and fertilizer costs. Tracking labor, equipment, and chemical costs enable you to make informed decisions when pricing your products to ensure greater profits.
Harvest yield records can be used to compare crop yield from year to year, to help growers make educated decisions regarding crop management in the future. You can’t manage what you can’t measure, so record keeping around harvest quantity is essential to growers tracking their income against cost of production.
Pesticide and Spray records are absolutely essential for both food and worker safety. Records of spray dates, chemicals used, and safety intervals suchs as the re-entry interval and the pre-harvest interval protect your customers and employees from exposure to potentially harmful residues. In many countries, chemical use reporting is mandatory to comply with regulations around food and environmental safety. Chemical use tracking is also a key part of tracking overall farm expenses.
Labor Tracking and worker productivity records are an aspect of record keeping that are essential for managing payroll and piecemeal payouts for your farm workers. More efficient payroll record keeping can save valuable time and money by speeding up the payroll process. Effectively tracking piece-rates for harvest can motivate workers, and make assessing overall productivity easier.
Many farms that employee temporary foreign workers are legally obligated to track not only hours worked, but hours offered to their employees, in addition to the usual hourly and overtime tracking, and to maintain detailed records of all employee activities on the farm.
Food safety and traceability are a growing concern for growers and consumers worldwide. The Global Food Safety Initiative, or GFSI, established in 2000 sets global food safety standards, and certifications that demonstrate that produce has passed its rigorous food safety standards. Global Good Agricultural Practices (G.A.P.) is the most widely used international standard for farm production, and includes standards for food safety and traceability, environmental protection, worker safety and welfare, animal welfare, and more.
Produce sold in the USA must additionally meet the FDA’s Food Safety Modernization Act (FSMA) standards.
To meet these standards, a rigorous auditing and record keeping system is required, to ensure safety and traceability of products being sold to consumers worldwide. Effective record keeping is also a must for an easy auditing season. The more accurate and precise records you have available for an auditor, the quicker and easier the process will be.
Regulations for food safety and record keeping can vary depending on the region. Chemical application laws for instance, are established regionally.
In the United States pesticide use is restricted by the 1990 Farm Bill which states that “all private applicators (those who apply pesticides to their own land) must maintain records of restricted-use pesticide (RUP) applications.”
In the EU, a comprehensive body of legislation regulates the use of plant protection products such as pesticides and their residues in food. Maximum Residue Levels, or MRLs, are the upper limit of chemical residues on food as set by the European Food Safety Authority (EFSA).
In New Zealand, agrichemicals are controlled as hazardous substances and must be used in such a way as to minimize environmental effects.
In Canada, chemical and pesticide use are regulated federally, with additional regulations at the provincial level if applicable. Canada GAP certification requires detailed record keeping for all agricultural chemical purchasing and receiving, application and storage.
The importance of record keeping regarding chemical and pesticide use cannot be overstated for growers of commercial fruit and vegetables.
When applying for grants or loans, whether as a small farm or a large business, detailed financial information and records are often required, either to determine eligibility or to prove that a farm is financially stable. Financial records, income statements, and expenses should all be up to date. Tracking farm income and expenses isn’t just important for your bank records though, good records will help you determine profits and identify any inefficiencies in your business.
In addition to the classic paper record keeping, there has been a recent trend for farmers to go digital with their record keeping, using spreadsheets, orchard management software, or farm management software to manage the extensive data collection they need.
Digital record keeping can range from simple excel spreadsheets and basic calculations to online data management tools.
Another popular trend in farm record keeping is the use of farm management apps. Farm management apps and other apps for farmers aim to make farm record keeping easier and more reliable using digital recording, with records often stored in the cloud for easy access from anywhere. Farm management apps range in complexity, from simple mobile farm record keeping spreadsheets to fully integrated recording systems stretching from planting to sale.
Keeping accurate farm records is crucial to growers who want to measure their efficiency and progress throughout the year. With comprehensive records, time spent on administrative work such as payroll and audits can be drastically reduced.
Better records also mean a better understanding of the strengths, weaknesses, and productivity levels around the farm, and can provide insight into best practices going forward. Food safety and traceability, topics at the forefront of the consumer consciousness, can be enhanced exponentially with effective recording processes.
Organized record keeping can cut audits down from a few days to a few hours, and these audits can allow growers to achieve food safety certifications, which in turn expand market access.
Data collection drives growth - as long as you can understand what your data is telling you.
Interested in learning more about Croptracker? Learn more about our Farm Management Software, or book a demonstration to schedule a meeting with our product experts.
And as always, if you're ever stuck, never hesitate to e-mail us at support@croptracker.com or Live Chat with us by clicking the green speech bubble ![]() in your bottom right-hand corner. We're always happy to help you make the most of Croptracker to make your farm more efficient, safer, and more profitable!
in your bottom right-hand corner. We're always happy to help you make the most of Croptracker to make your farm more efficient, safer, and more profitable!
Let our expert staff walk you through the Croptracker system, and answer any questions you have.
We are here to help.
Croptracker, developed by Dragonfly IT, is a record-keeping and operations management service which provides customers with advanced solutions to drive an increase in food safety traceability while decreasing overall operational costs. Our mission is to make crop production safer, more efficient, and more profitable for growers.