What is Starch?
Starch is a type of carbohydrate that is found in many plants, including fruits such as apples. In unripe apples, starch is the primary form of carbohydrate present, but as the fruit ripens, the starch is converted to sugar. The amount of starch present in an apple is one metric used to determine its level of ripeness, with more starch indicating that the fruit is less ripe.
The Starch Pattern Index
The starch test used in apple harvesting is based on the principle that iodine reacts with starch to produce a blue-black color. By applying an iodine solution to a cut surface of an apple, the amount of starch present can be determined by the staining pattern of the color produced. Different apple varieties may require different levels of staining to indicate the appropriate level of ripeness, so it is important to use the appropriate chart for each variety.
Along with firmness, size, background and red coloration, and brix, the starch-iodine test is one of the main preharvest tests apple growers use to determine the ideal harvest window. A Starch Pattern Index (SPI) is a visual tool used to estimate the starch levels in the fruit using an iodine solution. To determine the ideal window, testing for starch levels should begin at least four weeks before the expected harvest date, and additional tests should be done at least once each week until the optimum harvest window is determined.
Starch testing is also a key step in organizing storage inventory on harvested apples. After a certain maturity level has been reached in harvested fruit, it is no longer viable for long-term storage. Apple storage and packing facilities that sell fruit from outside growers will test starch levels at receiving locations as part of their QC processes. Fruit with like starch levels will be grouped and stored together for packing later in the season.
SPI Testing Ingredients and Method
Always follow the label instructions and wear appropriate personal protective equipment when handling and mixing chemicals. Avoid contact with eyes and skin, and wear gloves when preparing the iodine solution.
Warning. Iodine is a poisonous chemical. This iodine solution should be correctly labeled and kept away from children and pets. Consider treated apples poisonous and do not feed to any animal or use in composting.
- Dissolve 8.8 grams of potassium iodide in approximately 30 ml of warm water. Gently stir the solution until the potassium iodide is properly dissolved.
- When it is properly dissolved, add 2.2 grams of iodine crystals. Shake the mixture until the crystals are thoroughly dissolved.
- Dilute this mixture with water to make 1.0 litres of test solution. Mix them well.
Use a fresh batch of solution and apples that have been recently harvested. If the temperature of the apples, or of the iodine solution, is less than 10°C, inaccurate readings may result.
- Select ten trees from different areas of the block and tag them for identification purposes.
- Take one or two apples from different sides of each tree. Choose the most average-looking sample from the outside of the tree rather than the inner shaded area.
- Cut the apple in half at the equatorial line (Test the apples within 24 hours of collection to obtain accurate results).
- Apply the iodine stain to the cut surface of the apple. This can be done using a brush, by dipping the apples into the stain, or with a spray bottle.
- Wait for at least one minute to allow the iodine to react with the starch in the apple tissue.
- Arrange the apples in order of stain percentage by visually comparing the amount of iodine staining on each apple.
- Use the chart for interpreting iodine staining for comparison to determine the starch level of each apple.
- Use the chart for interpreting iodine staining for comparison to determine the starch level of each apple.
- Compare the starch levels for the variety to the corresponding chart to determine the ideal harvest window for the apples, or to determine the storage quality of harvested fruit.
There are various instruction sets from governmental and academic institutions we used to compile these instructions including Virginia Cooperative Extension, Michigan State University, and the government of Ontario.
SPI Scoring Systems Summaries:
While the testing process remains the generally the same across the board, there are several scales used around the world to assess the results. Some scales are variety specific and some are general and meant to be applied accross multiple varieties.
Cornell starch-iodine index
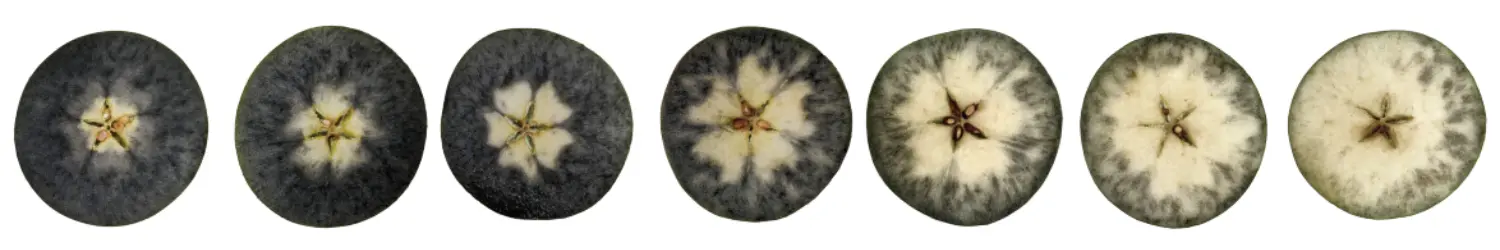
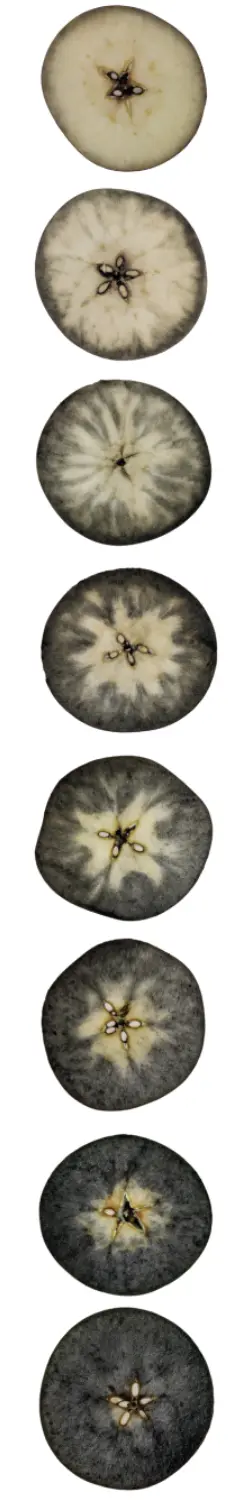
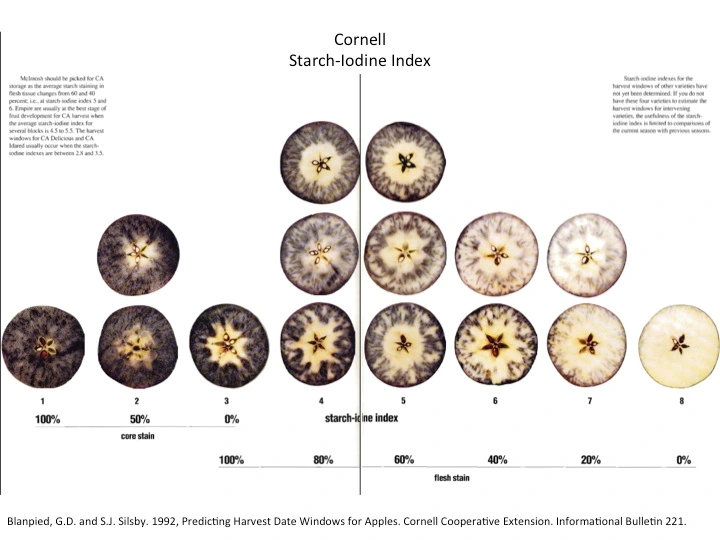
The Cornell starch-iodine scale is scored out of 8 with one being the darkest stain, and therefore most starchy and least ripe, and eight representing the lightest, most ripe apples. This chart is favoured by many growers because it can be consitently applied across many varieties. It is also the most widely cited scale in studies about breeding, long term storage and harvest timing. Because of the varietal consistently and extensive testing, the Cornell scale is the scoring system used in Croptracker’s Starch Quality Vision system.
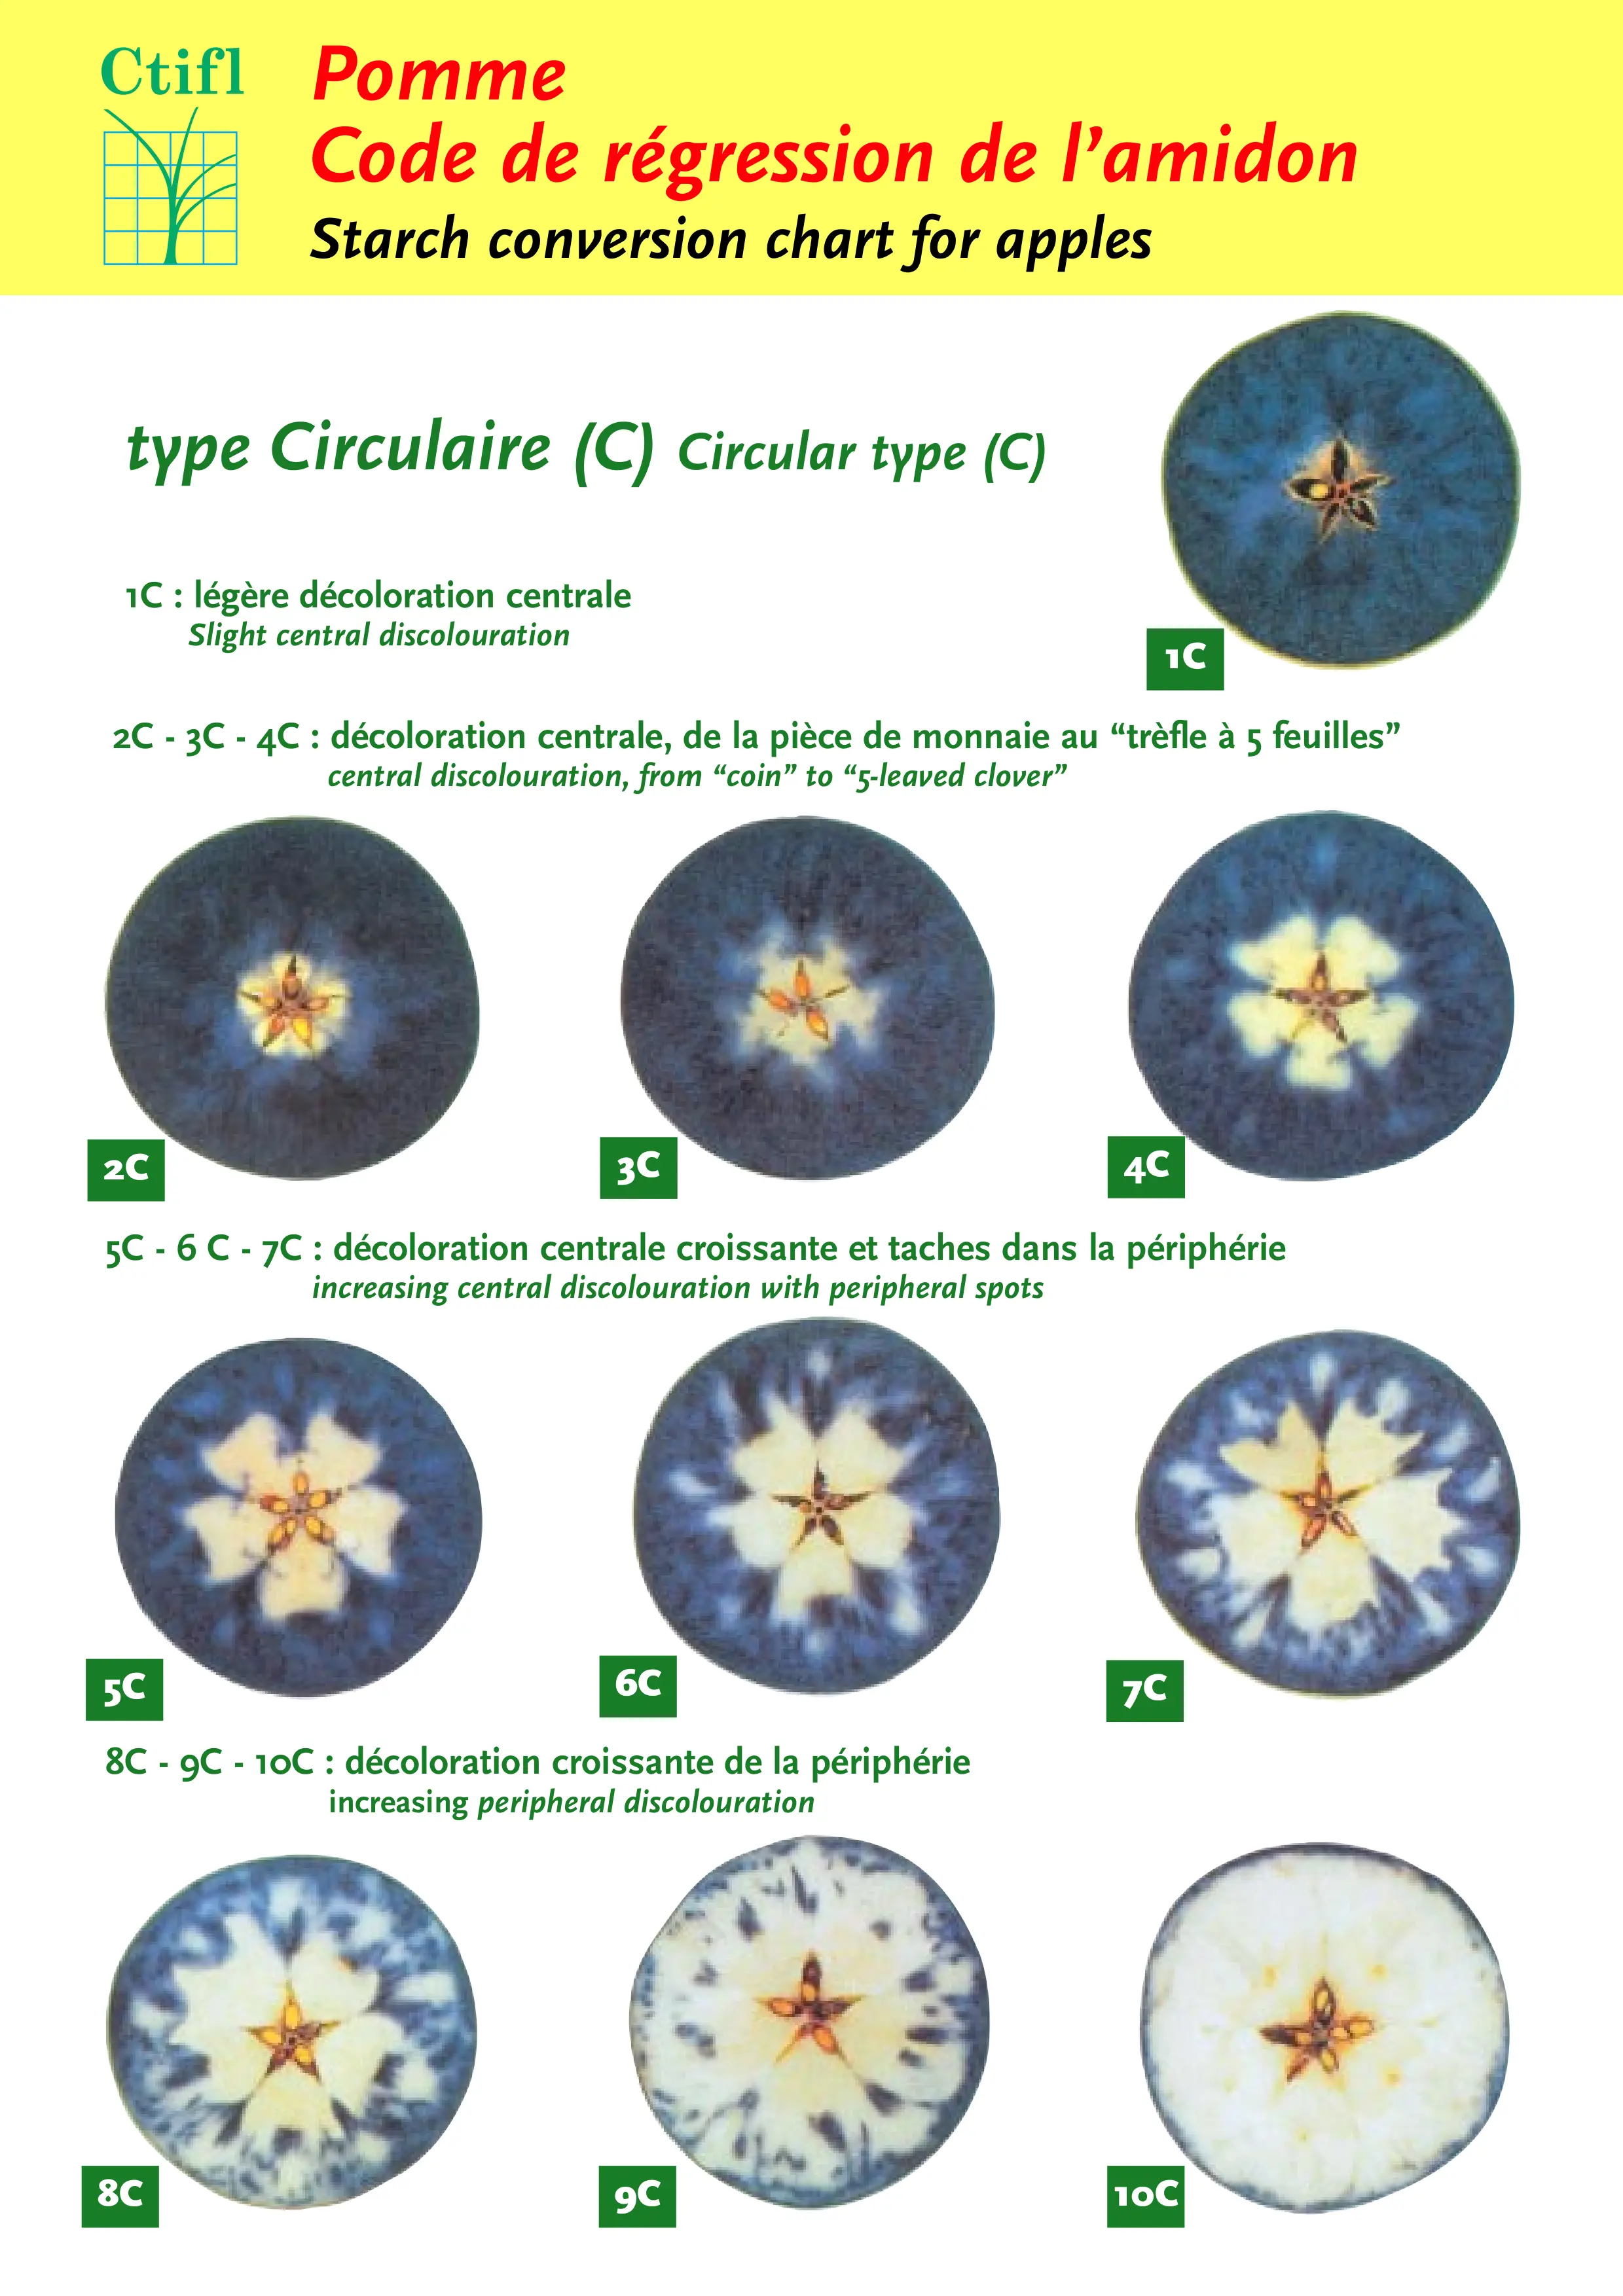
Centre Technique Interprofessionnel des Fruits et Lėgumes (CTIFL) scale
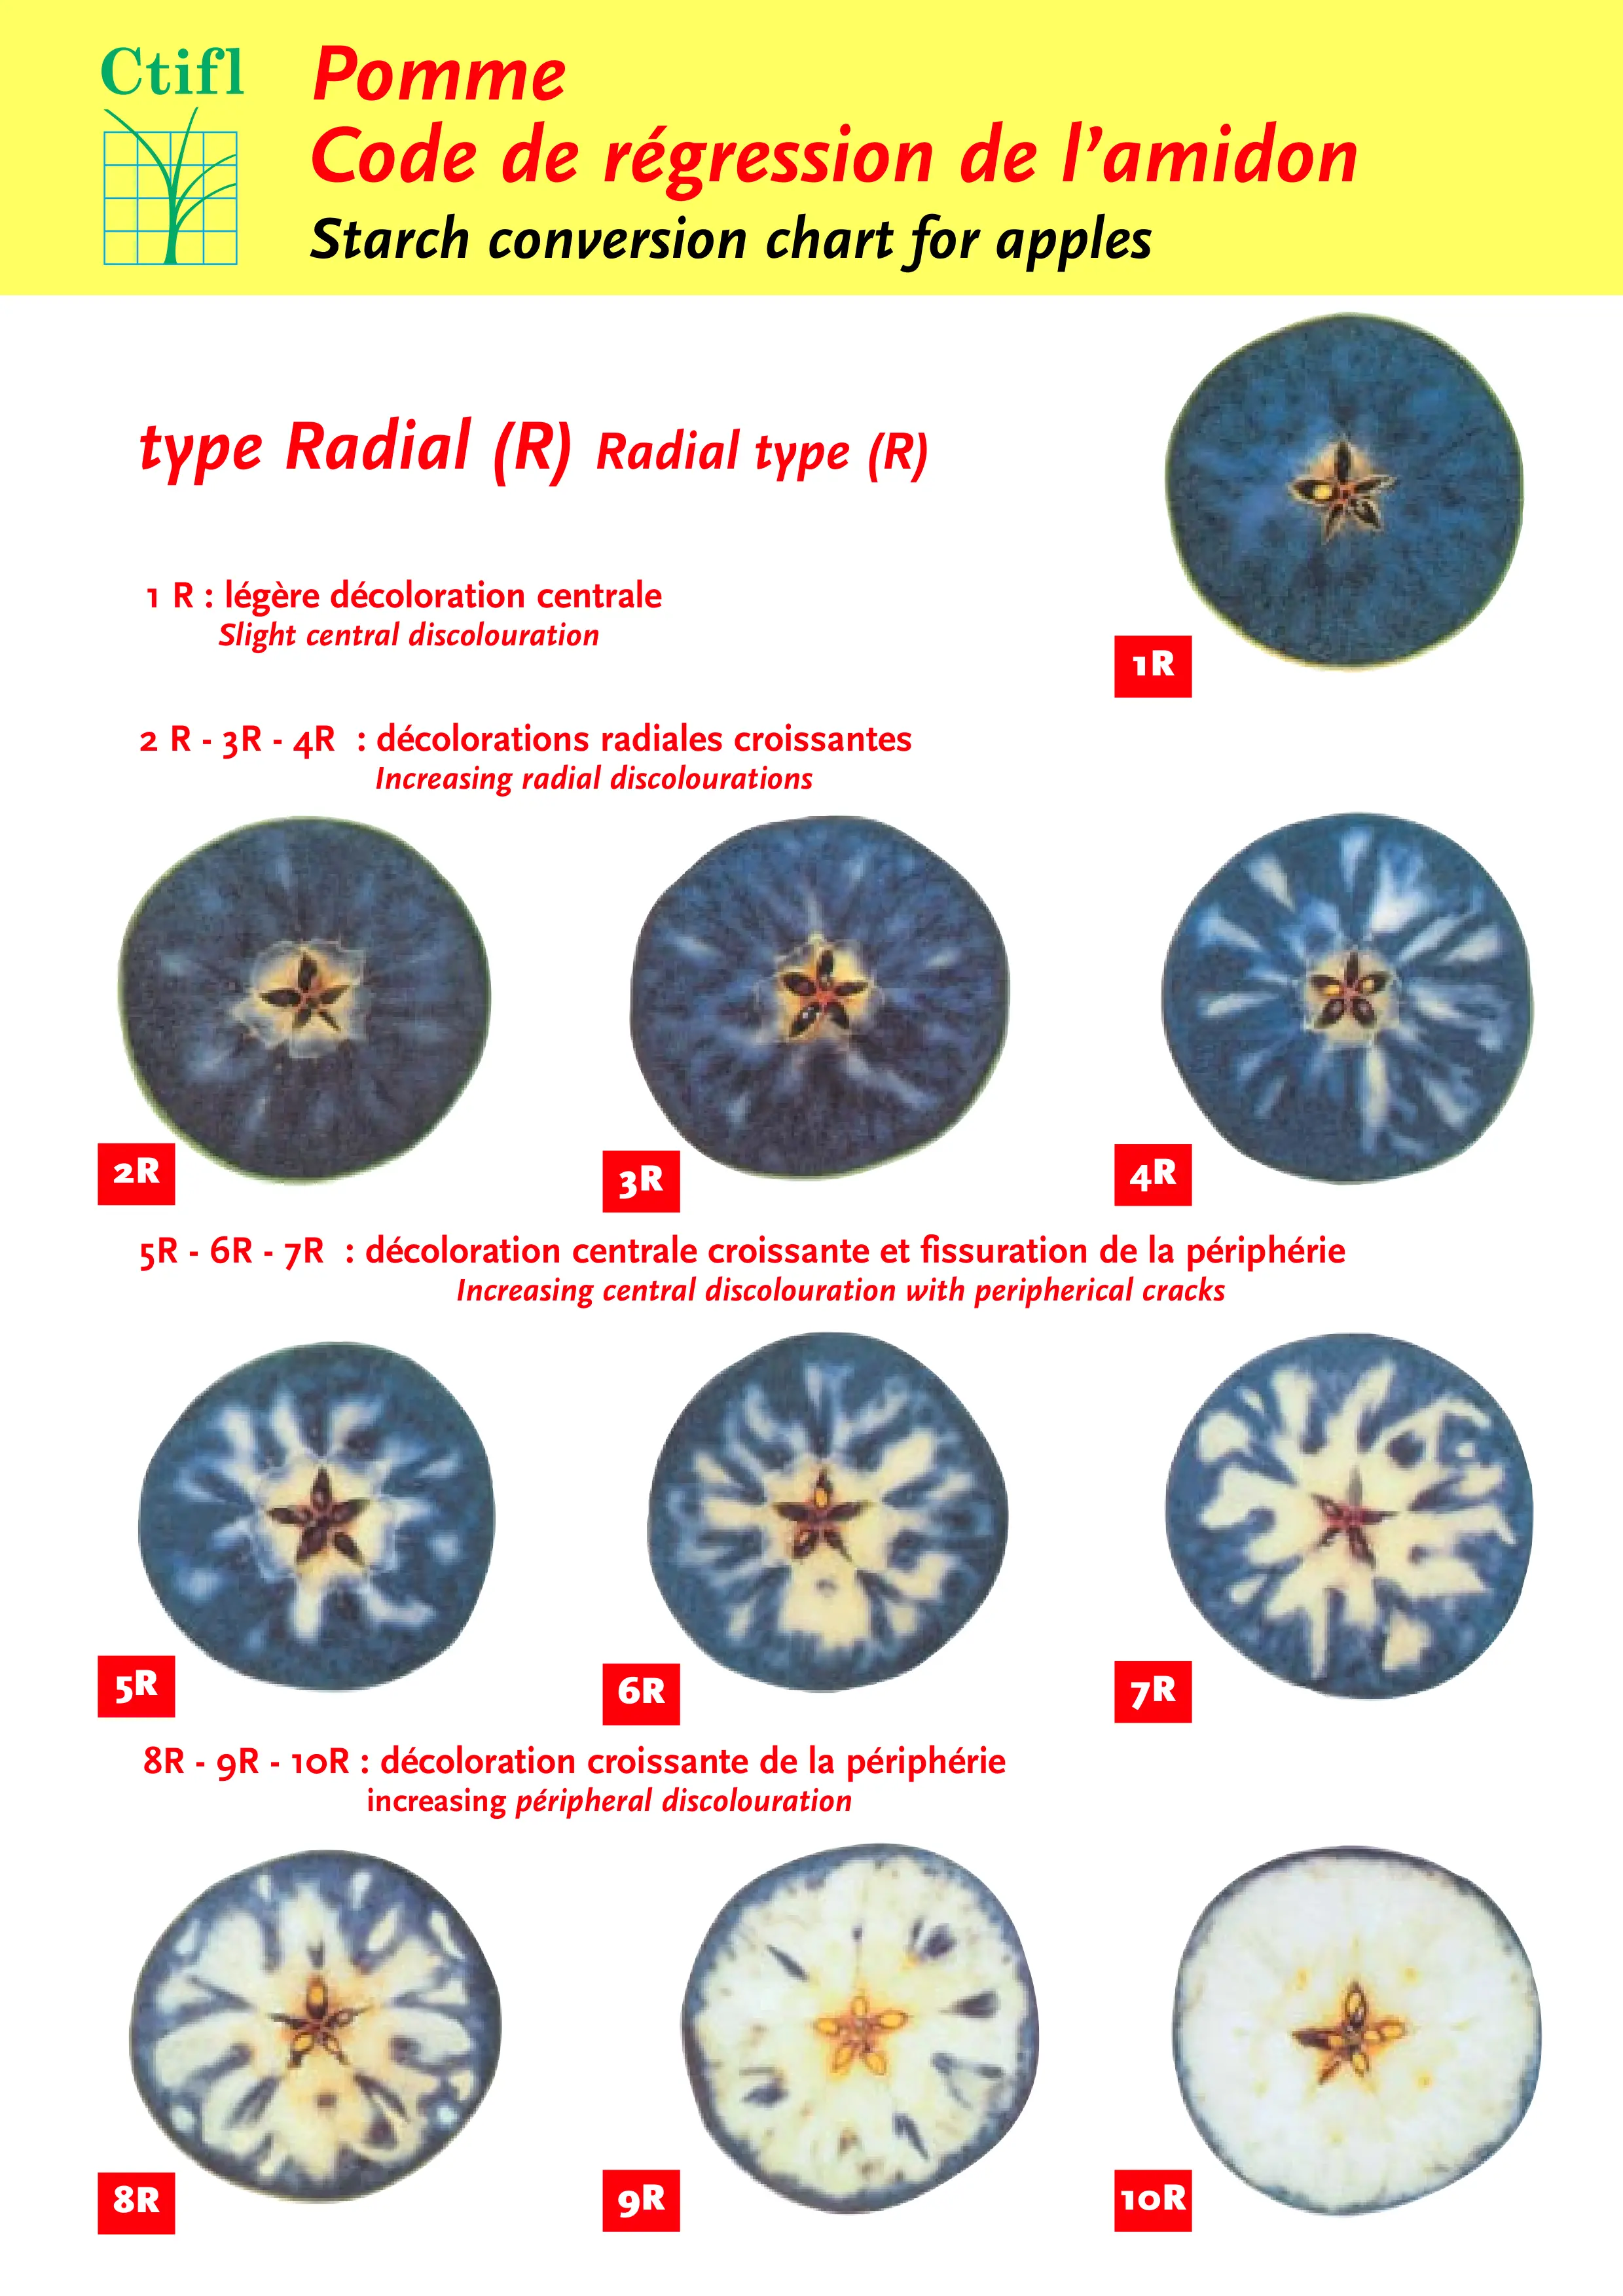
The CTIFL scale was developed in France with an emphasis on European cultivars specifically. It is often the scale used in harvest and storage reference guides for the Pink Lady/Cripps Pink variety. This chart uses the classic 10-stage scale and includes harvest window recommendations for several popular European varieties. The CTIFL starch scale system recognizes two staining patterns, the circular staining pattern, and the radial pattern which are applied to specific varities based on their common starch patterning.
Laimburg scale
The Laimburg scale is a 1.0 - 5.0 ranking to one decimal place used almost exclusively in European regions around Germany, Austria and Northern Italy and was developed by the Laimburg Research Centre. The scoring key also includes examples of the halfway point between the 1-5 scores. In these regions, the score is often converted to a ten-point scale after grading for use in the Streif Index Method, which uses both pressure and brix as well as starch to calculate apple maturity.
The Streif index:
Not strictly speaking an SPI, the Streif index is calculated from the results of three quality control tests; a starch test, a pressure test, and a test of soluble solids concentration, or Brix. The Streif Index is meant to be a more thorough and accurate measure of maturity than using starch alone. Lower values mean the fruit is closer to maturity, and the Streif Index is particularly valuable not just as a tool to determine the start of harvest, but to determine the last possible date.
Calculating the Streif coefficient
The equation F/(SSC x S) where F = Flesh firmness, SSC = Soluble Solids Concentration and S = Starch test results provides the Streif coefficient, which is then compared to the ideal values of individual varieties and regions.

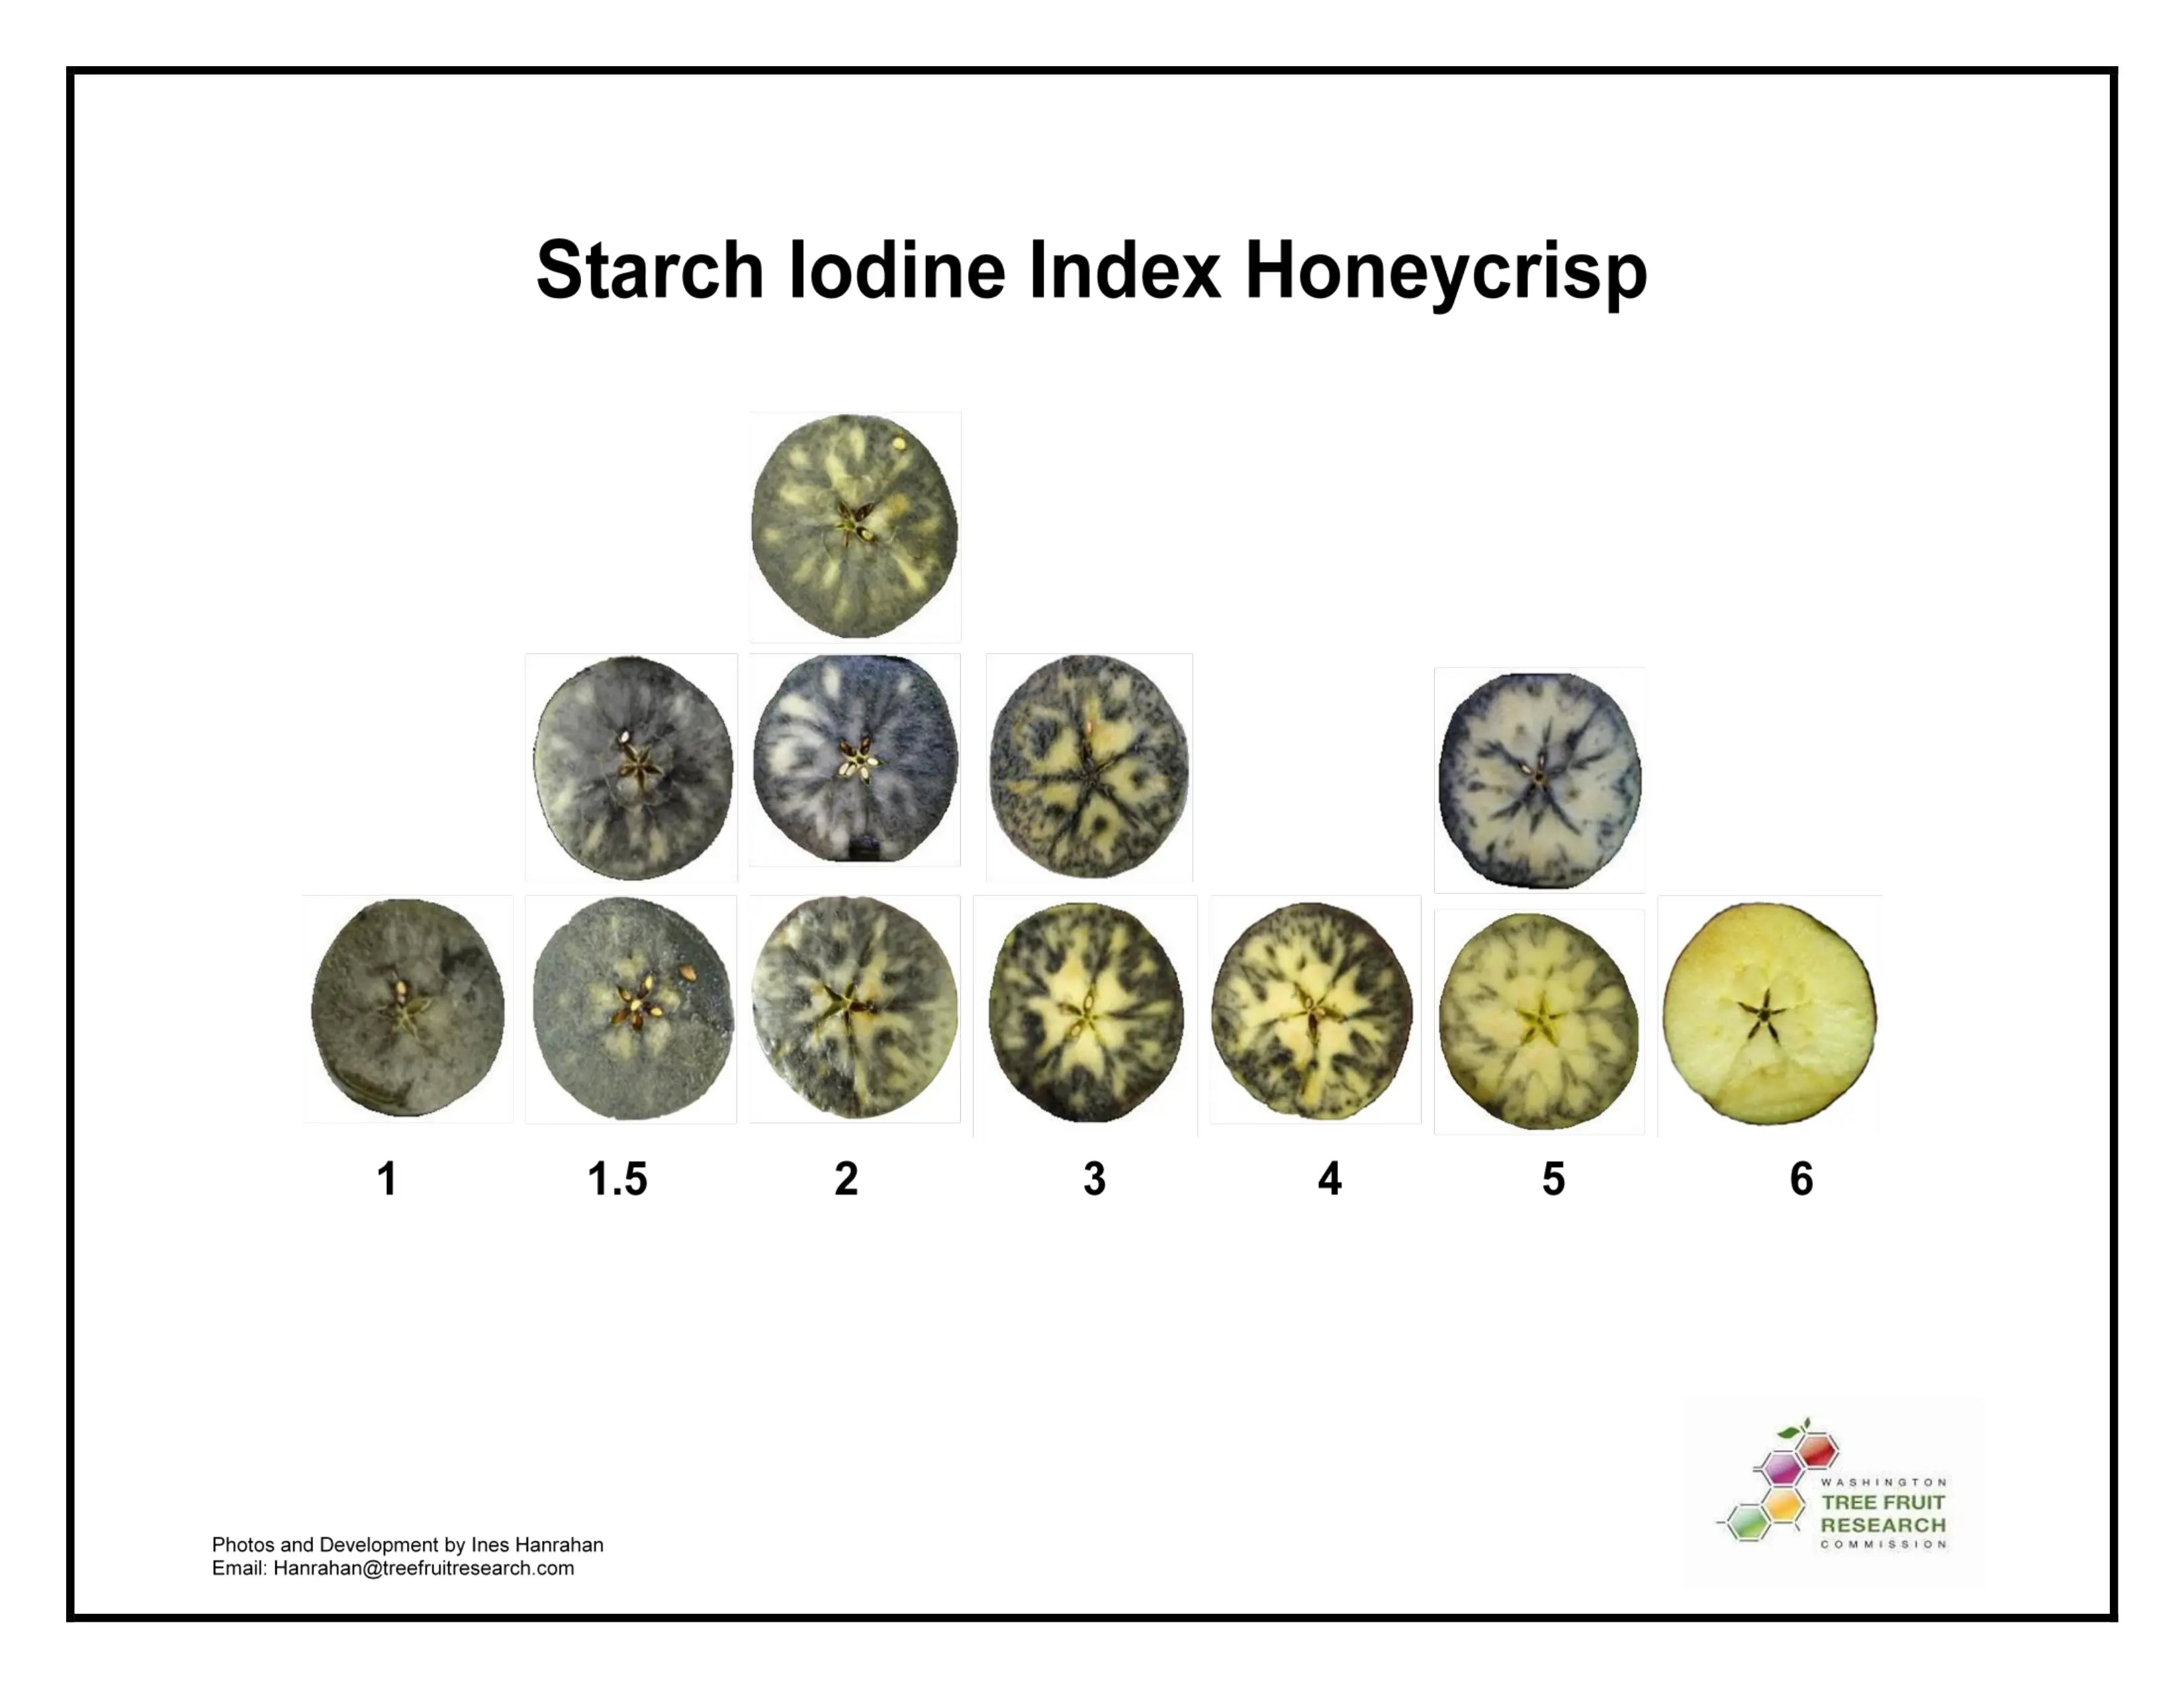
Washingston Tree Fruit Research Commision Honeycrisp scale
The ever-popular Honeycrisp apple is a sensitive cultivar with very specific storage requirements. The Washington State Tree Fruit Research Commission has created a specific Honeycrisp starch index for these finicky apples, which stain in patterns inconsistent with the other varieties and starch scales.
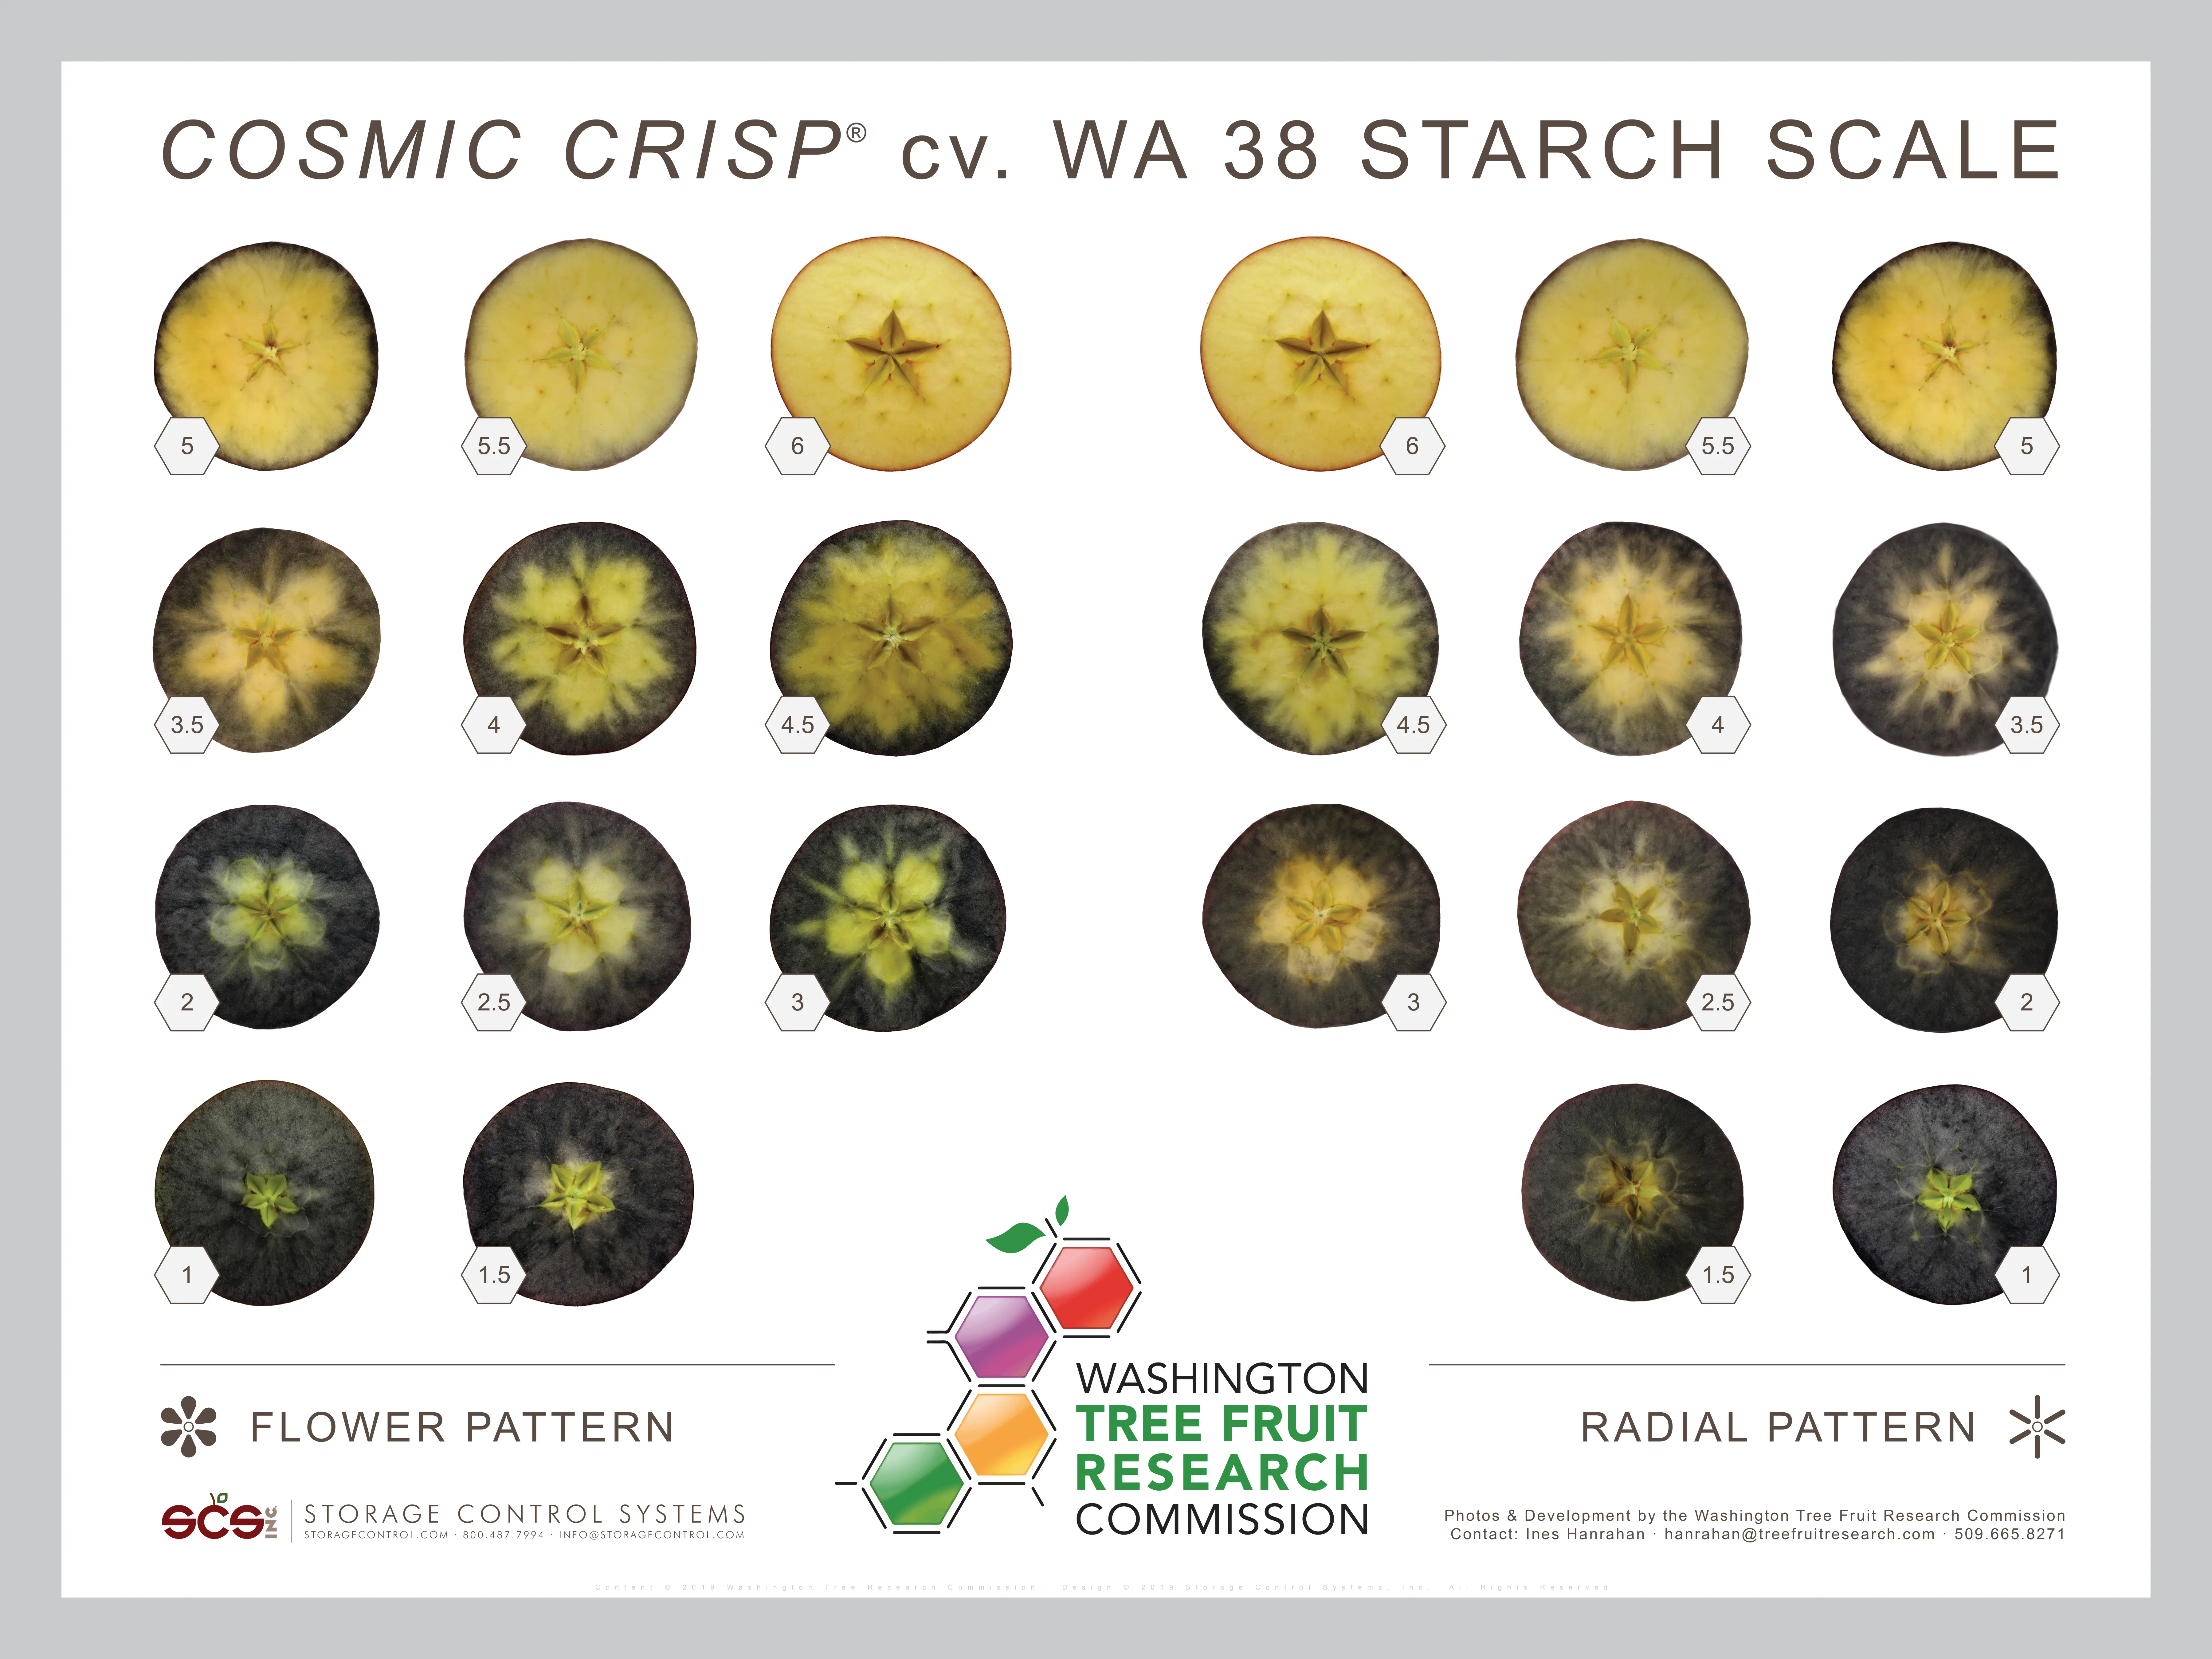
Washingston Tree Fruit Research Commision WA38/Cosmic Crisp scale
The WA38 Cosmic Crisp scale is a cultivar-specific scale designed for the unique staining pattern that occurs in cosmic crisp apples. This scale is out of six with a 0.5 interval and has two staining patterns to account for variability. There are extensive resources about growing Cosmic Crisp from the Washington Tree Fruit Research Commission to ensure the branded and IP-protected variety is consistent across growers, packers and markets.
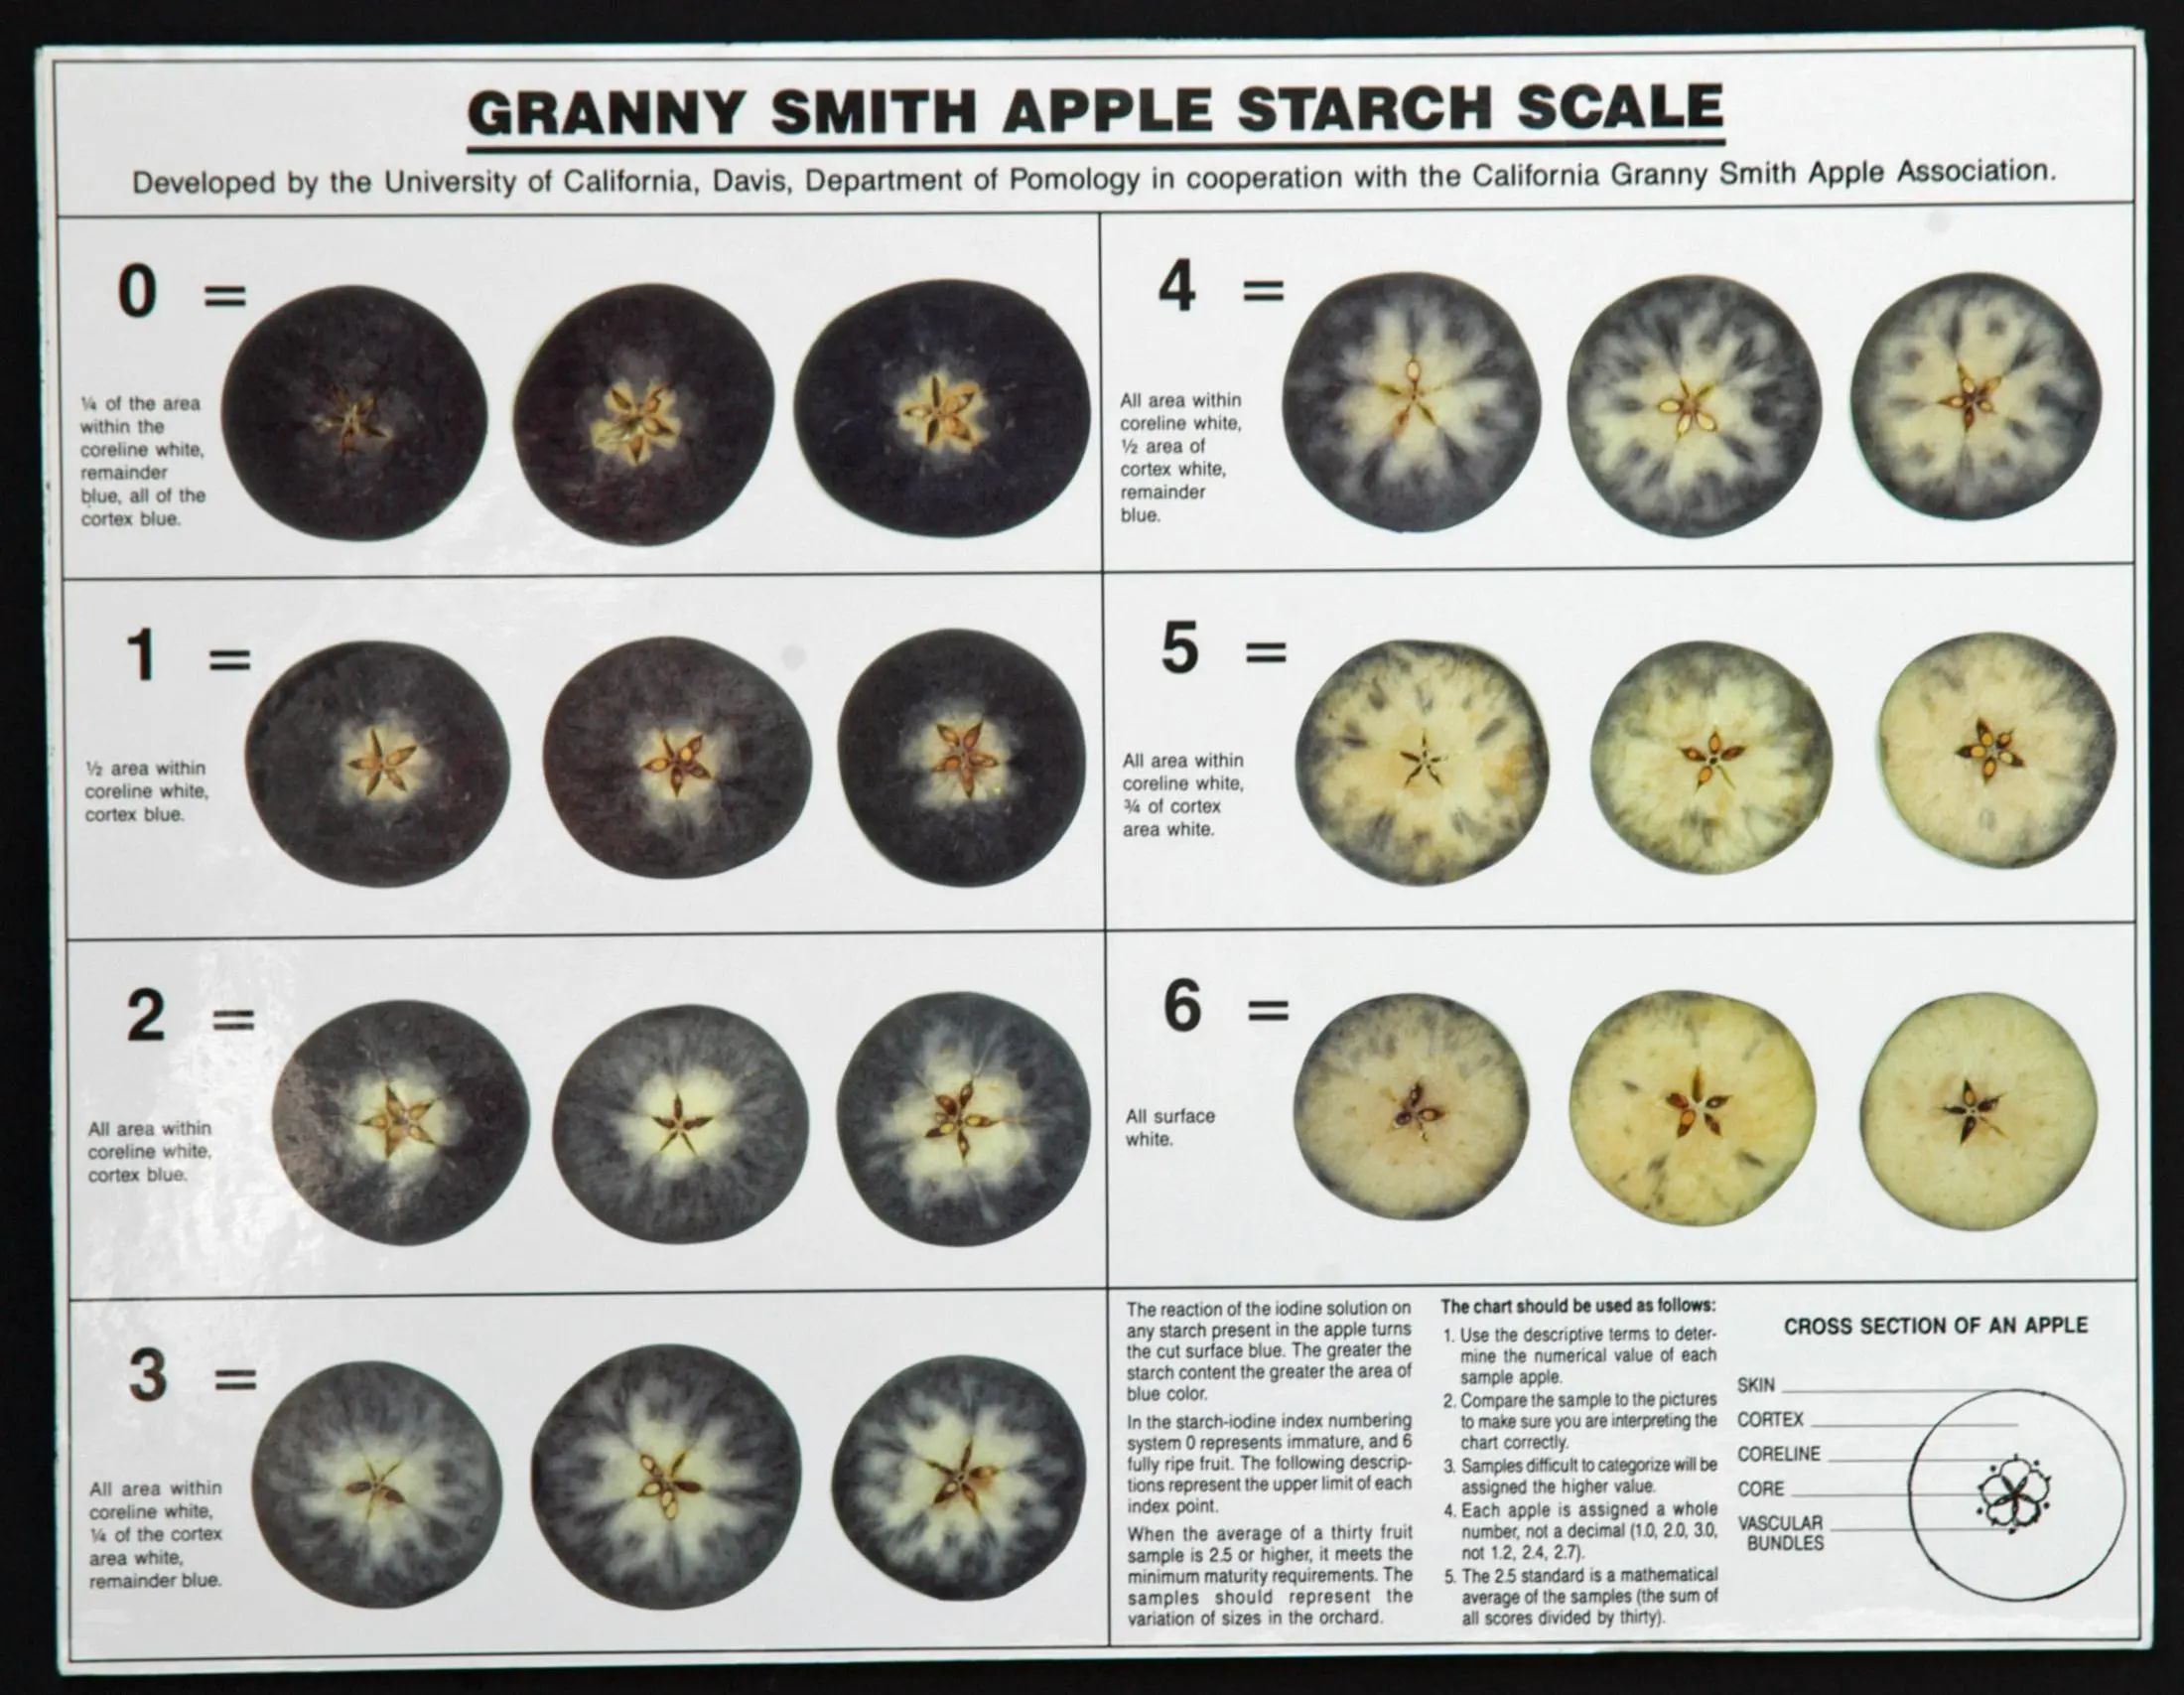
UC Davis Granny Smith scale
The Granny Smith scale was developed by the University of Southern California Davis Department of Pomology in cooperation with the California Granny Smith Apple Association (now known as the California Apple Commission). It is a scale from 1 to 6 with only whole numbers applied to individual scoring. It prompts testers to pay attention to key indicators in all regions of the apple cross-section, the skin, cortex, coreline, core and vascular bundles.
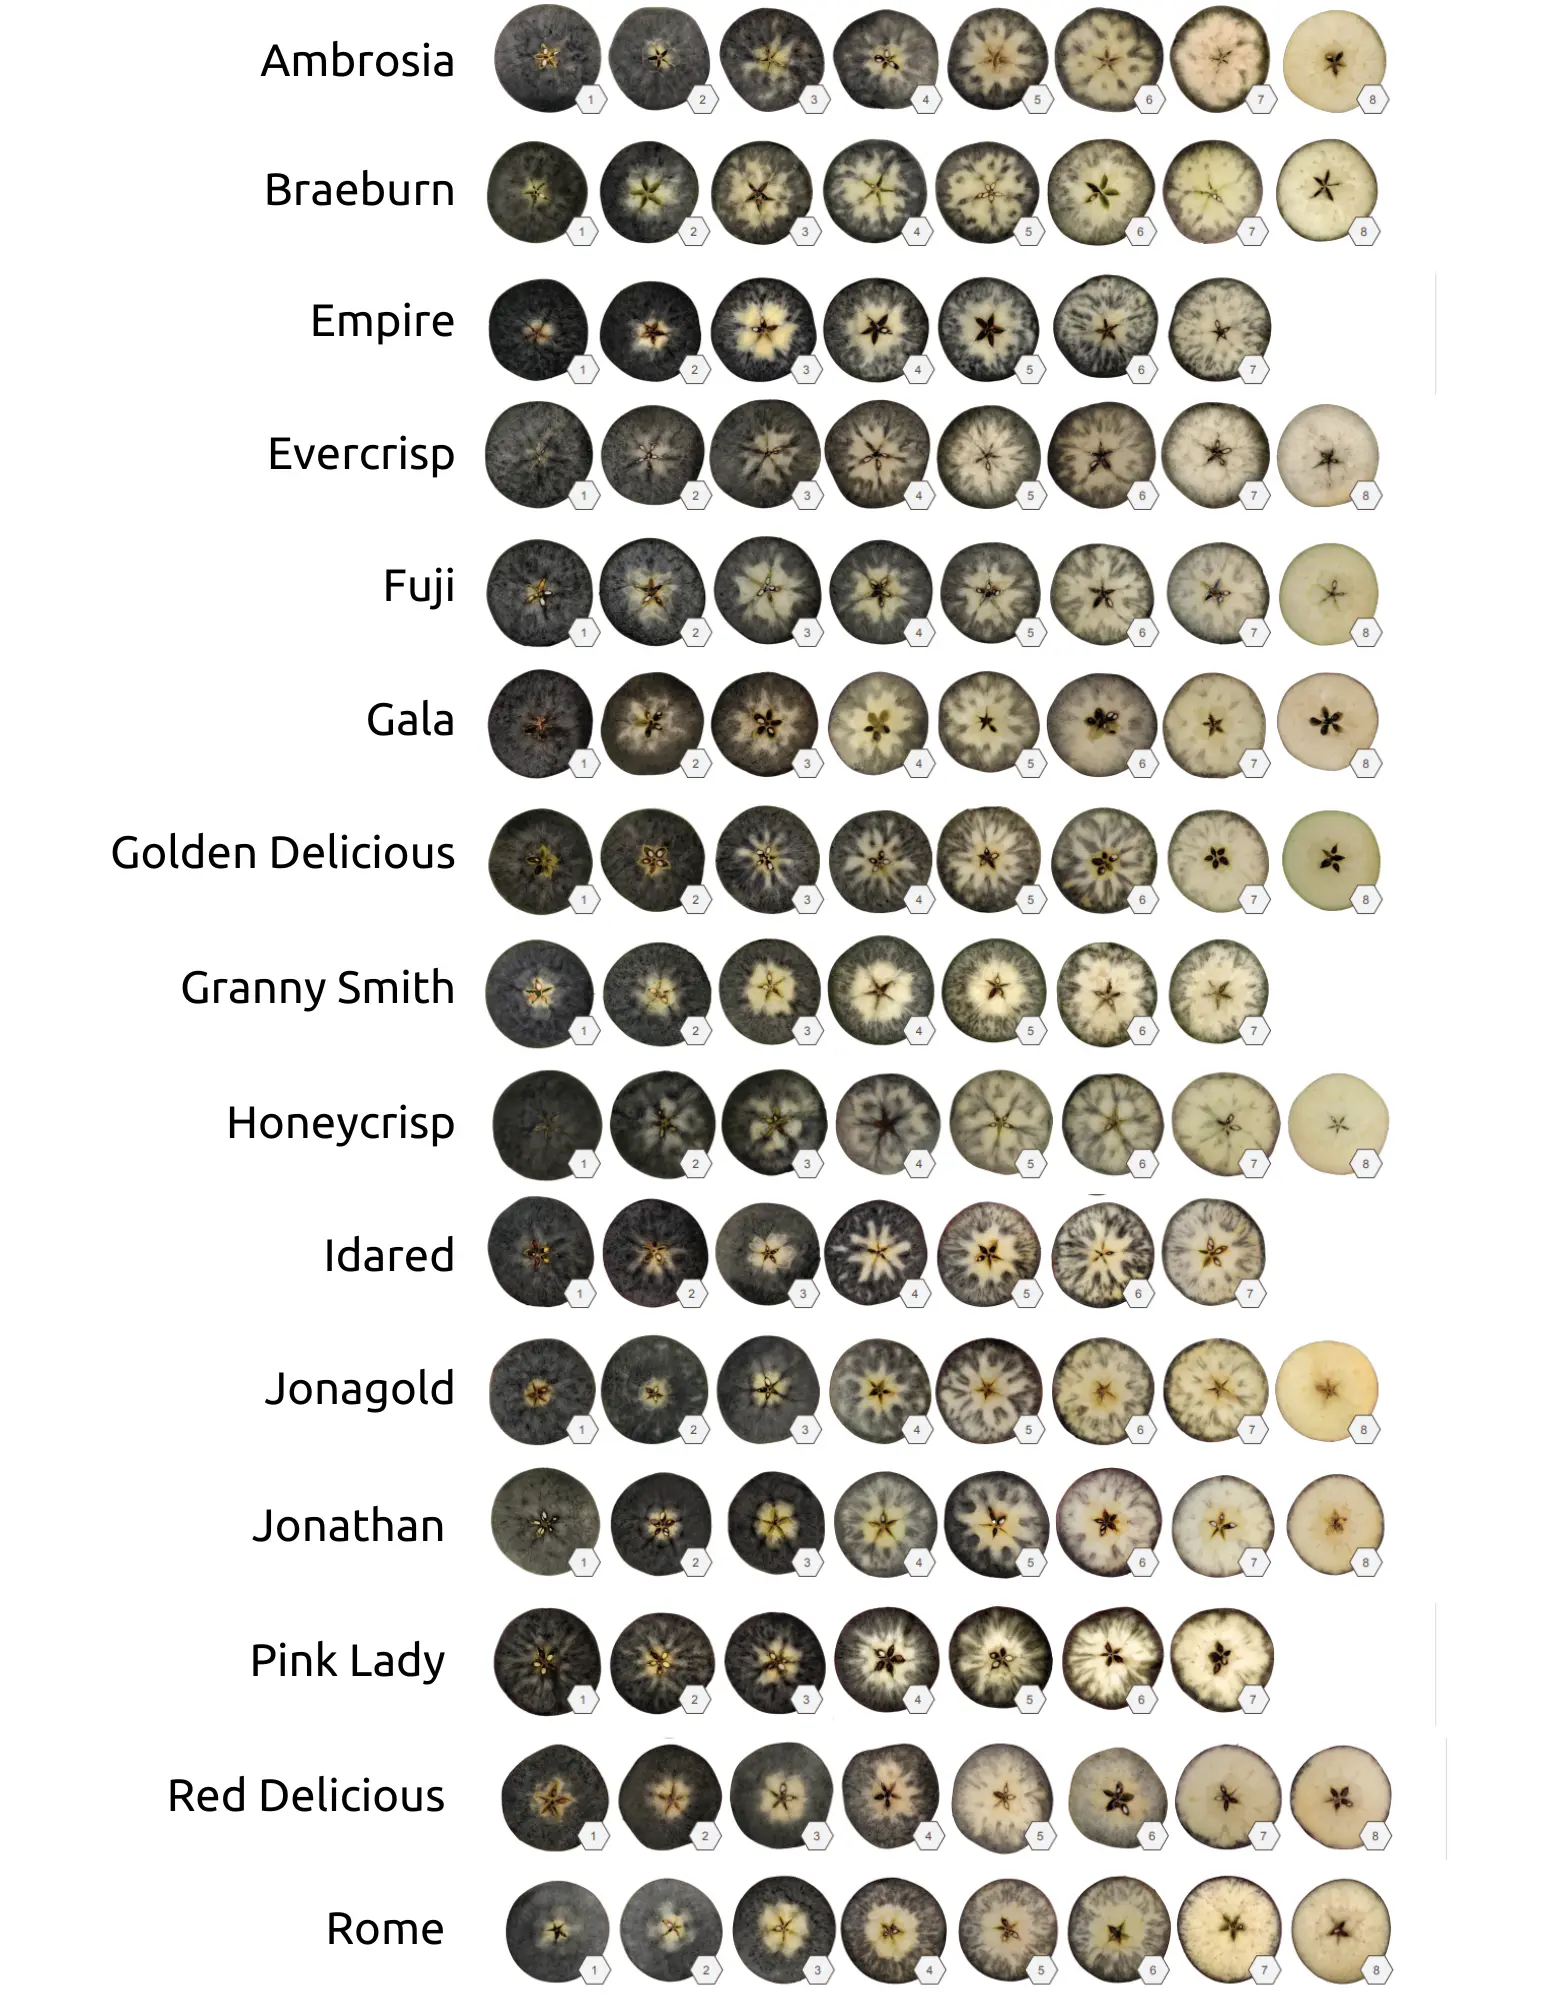
Michigan State University Apple Maturity Program starch index scales
The Michigan State University Apple Maturity Program has perhaps one of the most complete and varietal-specific starch index scale guidelines. Their index contains specific scale references for the main commercial varieties in Michigan, including Ambrosia, Braeburn, Empire, Evercrisp, Fuji, Gala, Golden Delicious, Granny Smith, Honeycrisp, Idared, Jonagold, Jonathan, Pink Lady, Red Delicious, and Rome. The scales go from 1-7 or 1-8 depending on the variety and this guide contains recommended storage ranges for short and long-term storage. The 1-8 range aligns closely with the Cornell scale making it useful in comparisons to research done using the Cornell scale.
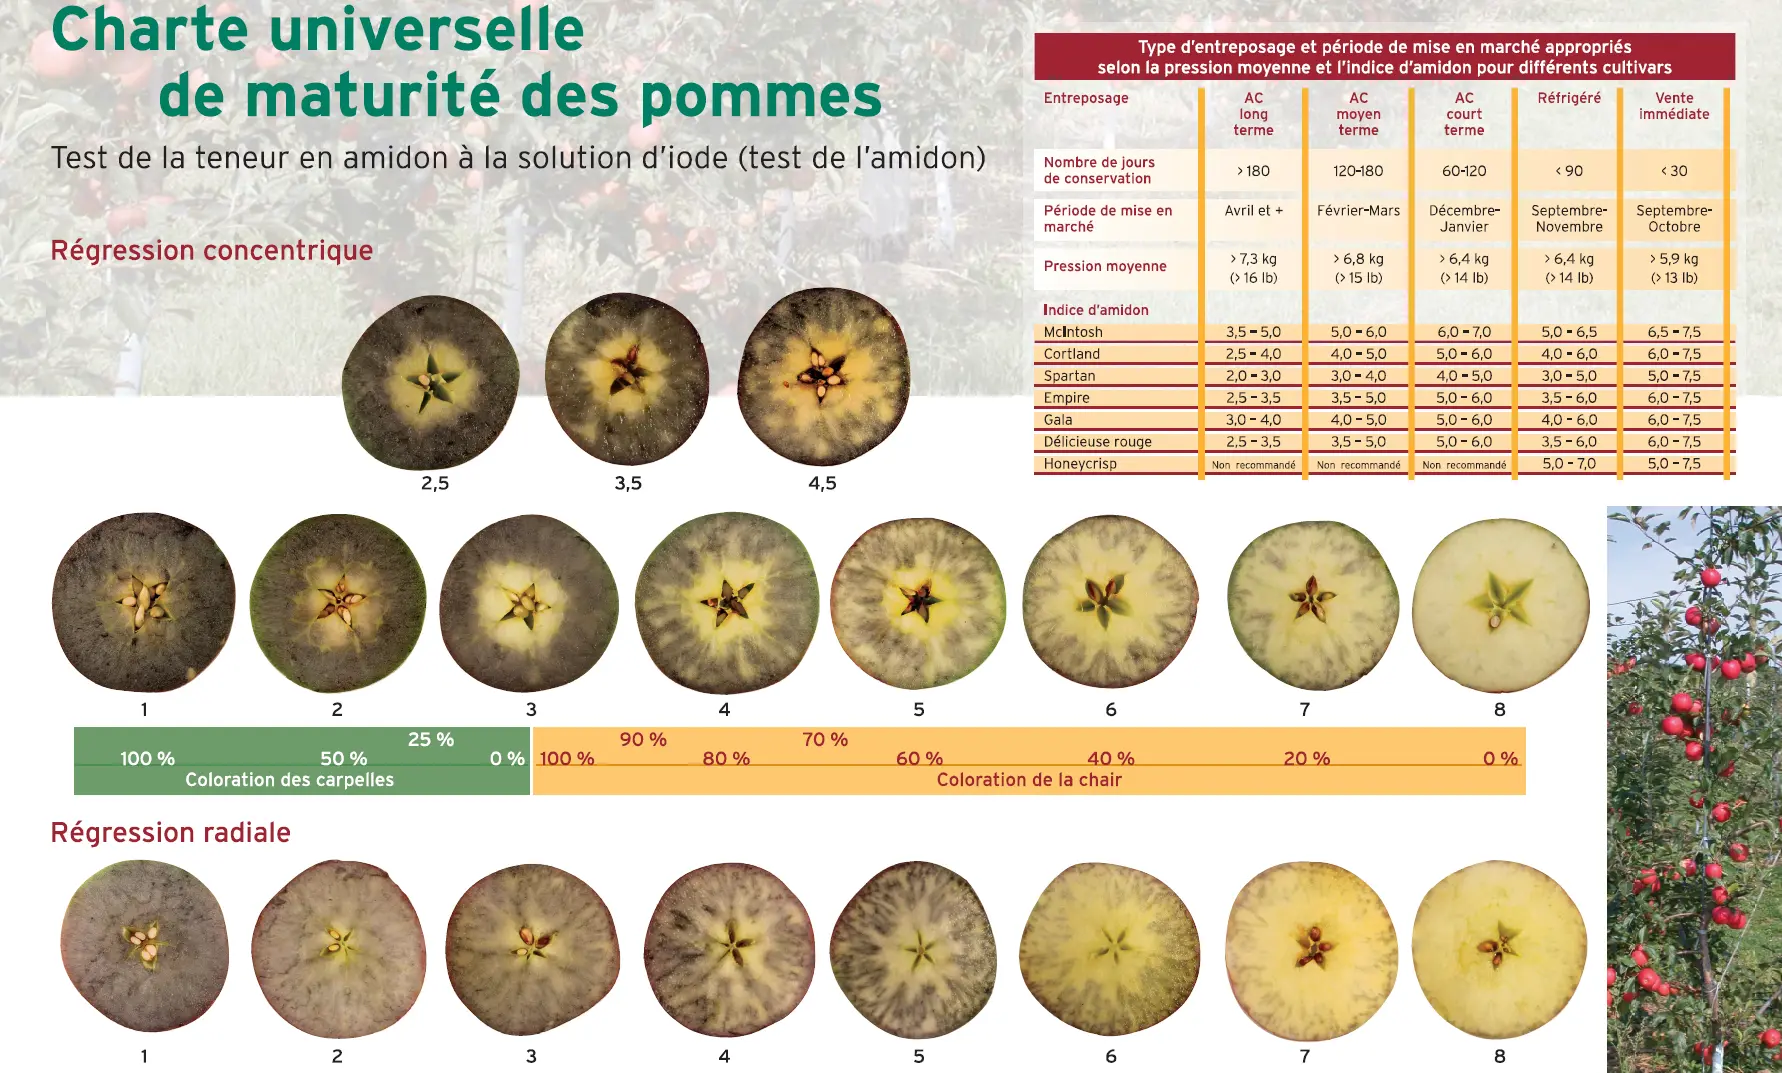
Quebec Agriculture and Agri-Food Reference Center Starch Testing Guide
Developed in conjunction with Les Producteurs de pommes du Québec (Quebec Apple Growers Federation), the Quebec Agriculture and Agri-Food Reference Center and Engage Agro, this scale covers several varieties and is especially useful as it also includes storage guidelines. The table in the top right corner shows the starch and pressure ranges needed for each variety to quality for long-term, medium-term, and short-term CA storage and for cold storage and immediate sale. Similar to the Cornell scale, the score ranges from 1 to 8 but includes both Radial and Circular (Concentric) pattern examples.
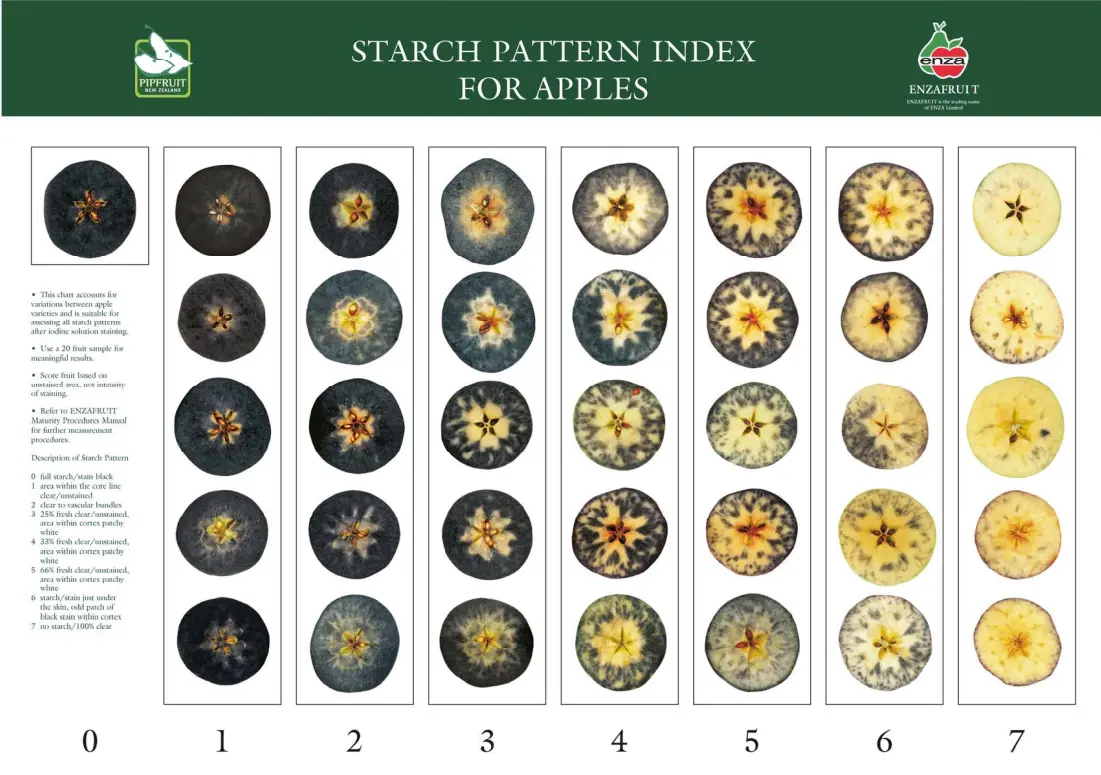
ENZAFRUIT / Pip Fruit New Zealand Starch Pattern Index for Apples
This scale was developed for use primarily in Australia and New Zealand, the ENZARUIT / Pip Fruit New Zealand (New Zealand Apples and Pears). It helpfully includes several examples for each score and ranges from 0 to 7 to accommodate different patterning tendencies. It includes some written descriptions of the size of the table for further clarification on the difference between the ranges and also suggests that growers use at least 20 apples per sample for meaningful results.
Starch Pattern Index Standards and the Subjectivity Problem
With so many variations in Starch Pattern Index scales and guidelines, it can be challenging to develop and maintain industry-level standards for grading. Many organizations develop their standards over the years. Internal guidelines used for their varieties can be a combination of the scales listed above and other regionally developed varietal scales.
Standards are also very difficult to develop in starch testing as the grading process is subjective. Two people using the same scale and looking at the same iodine-stained apple will not necessarily come up with the same score. Lighting, eyesight, and fatigue all play into how an individual assigns a starch score.
Several academic and industry studies have been done to assess the possibility of eliminating subjectivity through digital starch index assessment tools. Most of these tools use black-and-white imagery to determine how much white space vs iodine staining is present and assign a score based on this ratio. This method however fails to take into account the pattern variation that can impact a score significantly.
Croptracker’s Starch Quality Vision system uses pattern, color and stain ratio recognition to classify and score images in the app of iodine-tested apples on the Cornell scale. For more information on digital starch grading, check out the Starch Quality Vision page.
Frequently Asked Questions
What is the iodine test for starch?
The iodine test for starch is a method used by apple growers to determine fruit maturity before harvest. An iodine solution is applied to a cut apple, and the starch in the tissue reacts with the iodine to produce a blue-black stain. As apples ripen, starch converts to sugar, so less starch means less staining. By comparing the stain pattern to a variety-specific Starch Pattern Index (SPI) chart, growers can estimate how mature the fruit is and time harvest accordingly.
What is a good starch reading for apples?
The ideal starch reading depends on the variety and whether the apples are destined for fresh market or long-term storage. On the Cornell starch-iodine scale (which runs from 1 to 8, where 1 is most starch and 8 is least), most fresh-market varieties are ready at a score around 4 to 6. Apples intended for long-term controlled atmosphere (CA) storage are typically harvested at a lower starch conversion — around 3 to 4 — so they remain firm through the season. Check the variety-specific starch scale for your cultivar to find the exact target range.
How do you do a starch test on apples?
Follow these steps: First, prepare the iodine solution by dissolving 8.8 g potassium iodide in 30 ml warm water, adding 2.2 g iodine crystals, then diluting to 1 litre. Select 10 trees across the block and take one or two average-looking apples from the outer, sunlit side of each tree. Cut each apple in half at the equator. Apply the iodine solution to the cut surface using a brush, spray bottle, or by dipping. Wait at least one minute for the reaction. Compare the staining pattern to the appropriate variety-specific starch scale chart to determine the maturity score. Repeat weekly starting four weeks before estimated harvest.