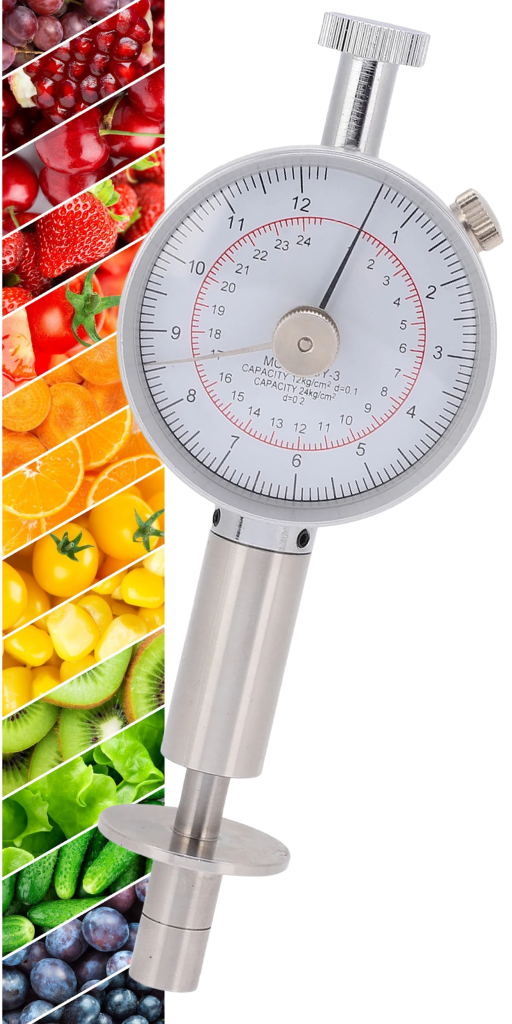
Produce firmness is the measure of resistance offered by the fruit or vegetable flesh (pulp) to an applied external force, such as pressure or compression. It is primarily a critical indicator of texture, but also reflects the fruit's internal structural health, ripeness, and its ability to withstand handling and storage conditions. While chemical indices like sugar content (Brix) and starch conversion provide insight into flavor development and physiological readiness, firmness testing provides the indispensable metric of structural integrity and shelf life potential.
Firmness is universally regarded as one of the five most important parameters in fresh produce QC, evaluated alongside dry matter, soluble sugars, titratable acidity, and color. Commercial fresh produce QC operations rely on standardized units of measurement, primarily pounds-force (lbs or lbf), Newtons (N), and occasionally kilograms-force per square centimeter kgf/cm2. Quantifying firmness using these objective measures replaces the highly subjective "hand-feel" assessment, allowing for precise, repeatable quality grading.
The softening of fruit is a fundamental physiological change that occurs during the ripening process. Softening results from structural degradation within the flesh. Specifically, it involves the breakdown and modification of cell walls and a reduction in the adhesion between individual cells, resulting in a loss of rigidity. (If you have ever bitten into a ‘mealy’ apple or a too soft banana, you will be familiar with how cell wall break down impacts fruit quality.) Because these structural and textural changes are synchronized with the conversion of starches into sugars, water, and carbon dioxide, the firmness of the fruit is often cited as the easiest and most reliable physical measure of the ripeness stage.
In climacteric fruits (e.g., Apple, Pear, Banana, Avocado, Mango), softening is an expected, ethylene-driven process that is synonymous with ripening. Firmness is therefore treated as a critical indicator of remaining shelf-life potential. In contrast, non-climacteric fruits (e.g., Citrus, Grape, Strawberry, Pineapple, Cherry) do not undergo a significant ripening phase after harvest. Firmness is primarily an indicator of freshness and structural damage.

The assessment of firmness provides a necessary physical verification that complements chemical maturity tests. Ripening involves parallel physical (softening) and chemical (sugar accumulation/starch clearance) changes. While Brix testing measures flavor (sugar content) and Starch-Iodine testing measures maturity (starch conversion), firmness testing measures the essential structural durability.
A potential risk in QC is accepting a fruit lot that is chemically mature but structurally weak. For instance, an apple might achieve minimum Brix targets but possess low firmness, meaning its cell walls are already compromised and highly susceptible to mechanical injury (bruising). Therefore, the firmness reading is necessary for balancing flavor and sweetness targets with the required shelf-life durability, thereby ensuring that the product maintains its texture and appearance until it reaches the consumer.
Growers use pre-harvest firmness to schedule ideal picking times, ensuring fruit will last through storage and packing to reach customers without the product degrading.
For growers of high-value crops like apples, pears, and stone fruit, firmness is a primary index used to schedule harvest windows. Harvesting fruit when it is too soft can lead to a drastically short shelf life and high rates of bruising, while harvesting too early compromises eating quality.
Firmness measured at harvest is decisive for the fruit’s storage potential. For example, fruit intended for long-term storage, such as apples destined for Controlled Atmosphere (CA) facilities, must achieve a minimum firmness of 15 lbs or more.
Store and pack house managers assess the effectiveness of cold chain or in-transit storage conditions by monitoring for accelerated softening during transit and storage and prior to packing. Pressure testing determines the suitability of fruit for long-term cold storage and is used to monitor fruit in ripening rooms to ensure it reaches the correct stage for the retail market.
Firmness is a direct predictor of post-harvest economic risk stemming from mechanical injury and rapid deterioration. Bruise damage is a significant factor in post-harvest losses, and the risk of bruising is strongly and negatively correlated with firmness. If a batch of apples is harvested at 12 lbs instead of the ideal 16 lbs for CA storage, that batch should be automatically assigned to sale much faster, potentially to only local markets.
Retailers and consumers use firmness to gauge the remaining shelf life and determine the product’s readiness to eat. Product department buyers will assess firmness during incoming fruit quality checks and will reject fruit that is too soft and will not last long enough on the shelf for the inventory to be sold. Consumers will frequently assess fruit firmness as a way to determine buying by handfeel, (all of us have picked up and put back a too firm avocado when we need to use it in a dish right away).
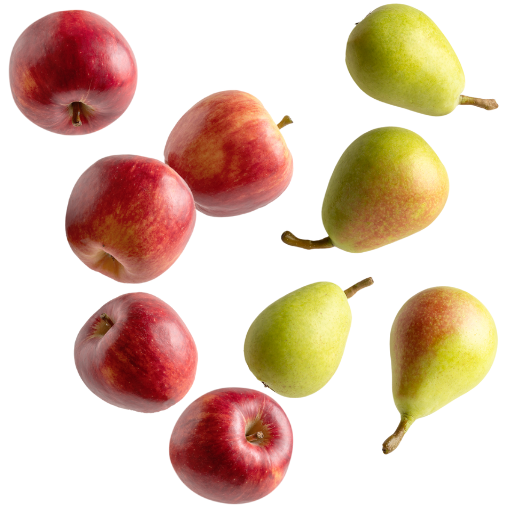
For pome fruits, firmness is the key determinant of storage longevity. Apples intended for long-term Controlled Atmosphere (CA) storage must consistently demonstrate flesh firmness above 15 lbs. Fruit intended for immediate fresh market sales can tolerate a slightly lower firmness, generally greater than 13 lbs. Some apple cultivars have more specific and precise storage firmness limited. For example, Gala apples intended for mid to long CA storage are targeted to have firmness greater than 17 lbs, while Fuji and the NY1 (SnapDragon) cultivars require firmness greater than 16 lbs.
Pears are also harvested at high firmness levels to ensure they withstand storage and can be ripened in a controlled environment later. Bartlett pears destined for long-term CA storage are judged ready for harvest when their firmness reaches an average of 19.5 lbs pressure, with a narrow harvest window of only four to seven days once this threshold is met. D’Anjou pears for long-term CA must reach 15 lbs. In contrast, ready-to-eat pears desired by consumers have a juicy, buttery texture that corresponds to a flesh firmness between 2 and 4 lbs.
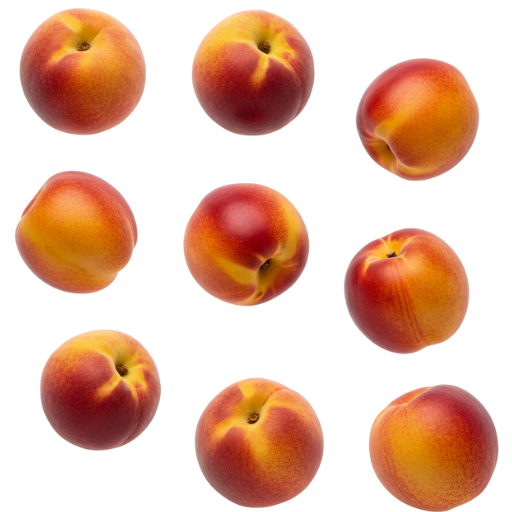
Quality control for stone fruit, such as peaches and nectarines, relies heavily on a firmness gradient that dictates the best path through the supply chain. Peaches picked for long-distance shipping require the highest firmness, typically in the 12 to 16 b range, to survive the rigors of packing and transport to regional warehouses. For fruit destined for medium-distance shipping or local farm markets, the acceptable range drops to 8 to 12 lbs. Fruit harvested with firmness below 6 to 8 lbs is considered to have high consumer acceptance, but requires exceptional care to avoid bruising and must be moved quickly. Peaches that achieve the ready-to-eat condition generally have a flesh firmness of only 2 to 3 lbs. Peaches that test below 8 lbs are more susceptible to developing mealiness at the wrong temperature.
The Magness-Taylor (MT) test, using a specialized penetrometer, has long been recognized as the "golden standard" method in both research and industry for measuring ripeness-related firmness. All other firmness measurement technologies are typically correlated back to the results of the MT test.
The principle of the MT test is to measure the maximum force (F), denoted in standardized units (e.g., kg/cm2 or pounds-force), required to puncture the fruit flesh to a predetermined depth using a probe (plunger) of a standardized diameter.
The procedure requires carefully removing a disc of the fruit's skin before inserting the probe, rendering the tested fruit sample unsalable.
Although accurate, the MT method is also recognized as time-consuming and labor-intensive, often requiring a large sample size to obtain reliable average measurements for the entire lot.
MT testing utilizes penetrometers, which are essentially calibrated dynamometers. These instruments range from simple handheld analog fruit testers to advanced digital force gauges.
Digital units are increasingly favored because they offer features such as easier digital reading, max hold functionality, and instant unit conversion between Newtons, lbf, and kgf/cm2.
Consistency in sample preparation and application of force is paramount for generating reproducible and reliable firmness data. The procedure generally follows these steps:
Standard Magness-Taylor penetrometer probe tip selection
| Fruit size | Example crops | Recommended tip diameter (mm) |
|---|---|---|
| Large / hard fruit | Apples, Asian Pears | 11 mm |
| Stone fruit / medium fruit | Peaches, Pears, Avocados, Nectarines, Kiwi | 6 mm - 8 mm |
| Small / soft fruit | Cherries, Grapes, Berries, Strawberries | 3 mm - 6 mm |
Some newer and non-destructive firmness testing methods allow for rapid, whole-lot testing, minimizing product damage and maximizing efficiency. Using a traditional penetrometer can lead to inconsistent results because of variation in penetration speed.
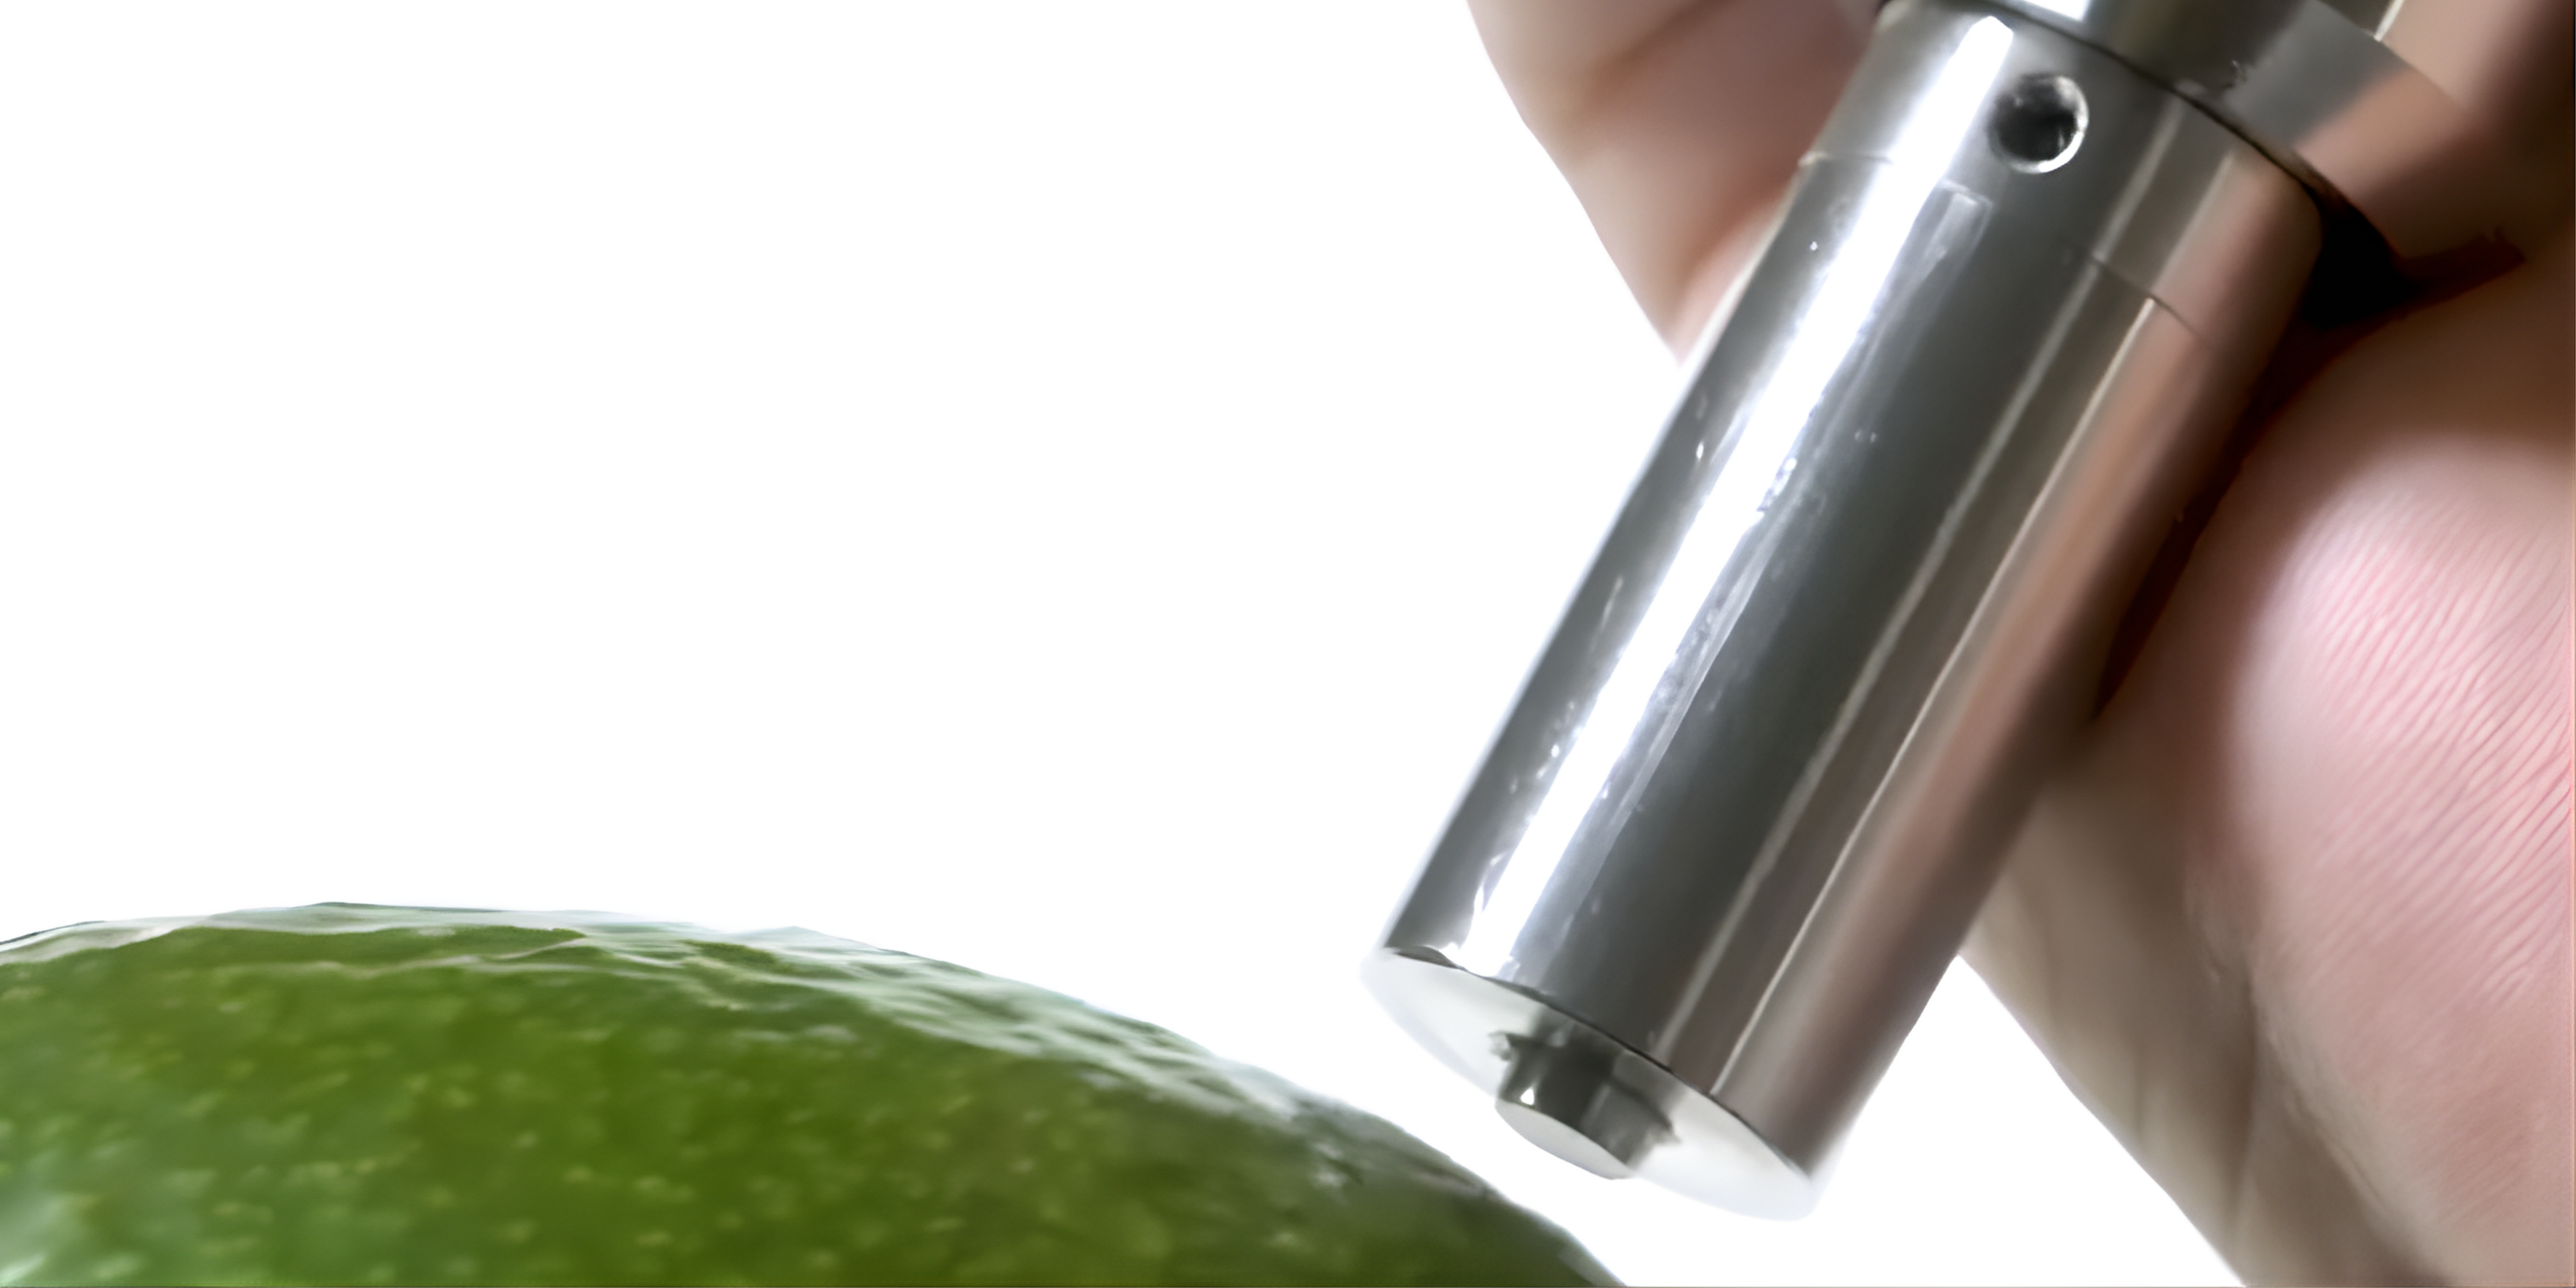
Durometers are instruments that determine the force resistance of the fruit tissue to a small, standardized probe, typically 3 mm in diameter. These are often employed for softer fruits where full penetration with a penetrometer is messy or not possible. Proper use of durometers requires a two-point calibration: zeroing the device away from surfaces, and then verifying the high end by pressing it against a glass surface to read 100.
The tip of the durometer is pressed against the sample fruit and the firmness will be between the no resistance 0 and the 100 level hardness of the glass surface used to calibrate the tool. This scale is based on the ‘Shore Hardness Scale’ and is made specific for fresh produce using the ‘Durofel’ scale. Durometers do not require fruit samples to be cut or destroyed during testing and results are often more consistent than penetrometers.
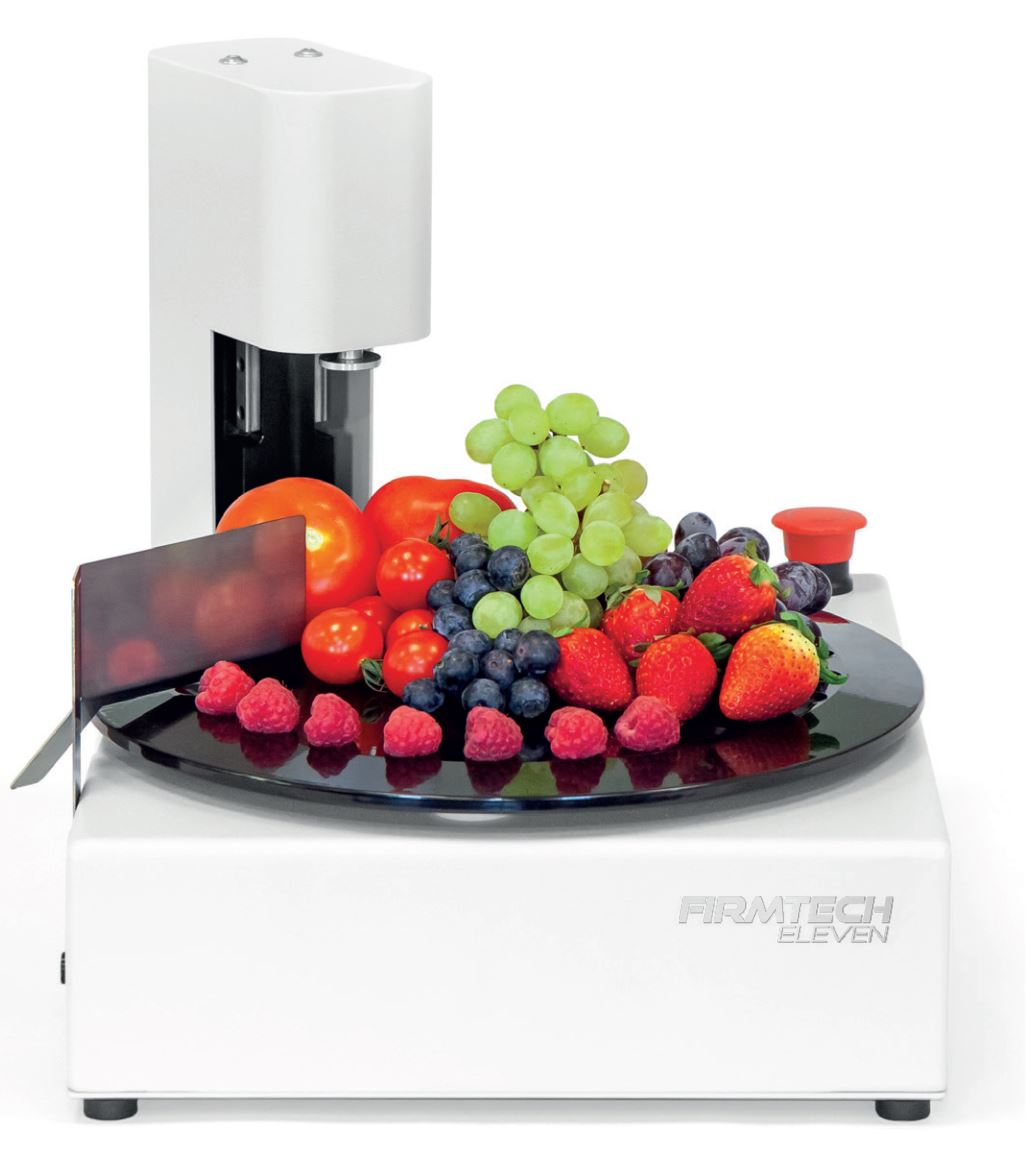
Compression-based methods do not puncture the fruit but measure the force required to deform the fruit by a specific distance. These systems determine the "slope" of the force-compression curve, often yielding a Mean Chord Stiffness (MCS) value. MCS is cited as being the best indicator of fruit firmness for small, highly sensitive fruits such as cherries, blueberries, and strawberries, which are poorly suited for puncture testing. Compression testing tools often come with the advantage of automating data capture as they digitally record the sample results as it moves through the specimens automatically.
While NIR technology is predominantly used to measure internal chemical attributes like sugar content and dry matter, it is increasingly being leveraged to predict physical traits like firmness. This involves calibrating NIR spectroscopy tools with many pressure tested fruit samples so the network used by the NIR tool can return an accurate pressure reading.
Two classes of instruments are used to measure firmness in fresh produce most commonly, penetrometers and durometers.
Penetrometers are designed to measure the maximum force required to puncture the fruit flesh to a specific, pre-determined depth using a standardized probe. This method is destructive, as it requires removing the skin and puncturing the fruit. Penetrometers use the Magness-Taylor scale.
Durometers measure the force resistance of the fruit tissue to a small probe, ~3 mm in diameter. Durometers are often used for softer fruits where full penetration is impractical, or in non-destructive compression methods for small, sensitive fruits like berries. Durometers use the Shore hardness scale.

Pressure testing, whether through the Magness-Taylor standard or modern non-destructive methods, is the indispensable physical verification that complements chemical maturity testing in fresh produce QC. The reading provides a quantitative, objective measure of the fruit's structural health, which directly dictates its texture, ripeness stage, and ability to withstand the supply chain.
For quality control, firmness is critical for balancing flavor development (measured by Brix and Starch-Iodine) with essential shelf-life potential. Ignoring firmness means risking the acceptance of fruit that is chemically mature but structurally weak and highly prone to bruising and rapid deterioration.
From the pre-harvest decision to the final retail check, firmness is a direct predictor of post-harvest economic risk. It determines a lot's suitability for long-term storage and its susceptibility to mechanical injury—the leading cause of post-harvest loss.
By applying consistent protocols and selecting the appropriate tools—be it a classic penetrometer for high-value crops or advanced compression/NIR methods for speed and precision—growers, packers, and retailers can move beyond subjective "hand-feel." Pressure testing provides the clear, actionable data necessary to guarantee product quality and maximize marketable yield from the field to the consumer's table.
The modern fresh produce supply chain operates under immense pressure to deliver consistent quality, minimize waste, and ensure timely distribution. Traditional quality control testing which relies on destructive sampling, chemical analysis and subjective visual assessments are slower, labor-intensive, and prone to measurement variability. To address these challenges, some fresh produce industry players are looking to the non-destructive quality assessment functions of Near-Infrared (NIR) testers.

Near-Infrared (NIR) testing is a broad term with many applications. In this context, we are talking about NIR spectroscopy tools which quantify numerous internal quality properties simultaneously, including soluble sugars (Brix), organic acids, and dry matter content. QC teams are regularly testing for many of these metrics separately with a series of tests and tools, often resulting in destroying sample fruit. NIR readers will assess many of these qualities at once without having to lose any product to the sampling process.
In fresh produce testing, some growers are also using a specialized form of hand held NIR tool called a DA meter. They are specifically engineered to monitor the degradation of chlorophyll by measuring the chlorophyll content in the plant’s leaves or fruit skin using the Index of Absorbance Difference (IAD) . The correlation to ripeness is inverse: as the fruit ripens, the chlorophyll breaks down, which leads to higher chlorophyll levels that indicate greener, less mature fruit. Once ripening is complete, the index reaches very low values. We have specifically defined DA meters as they are often sold as separate and cheaper NIR tools for specific crop types, but many fresh produce geared NIR testers will also return chlorophyll level results.
NIR spectroscopy is rooted in fundamental physics, utilizing electromagnetic radiation within the near-infrared spectrum, typically ranging from 700 to 2500 nanometers (nm). This range sits just beyond the visible light spectrum. The technique relies on the principle that all substances, including food products, emit electromagnetic radiation through the vibration of their molecules.
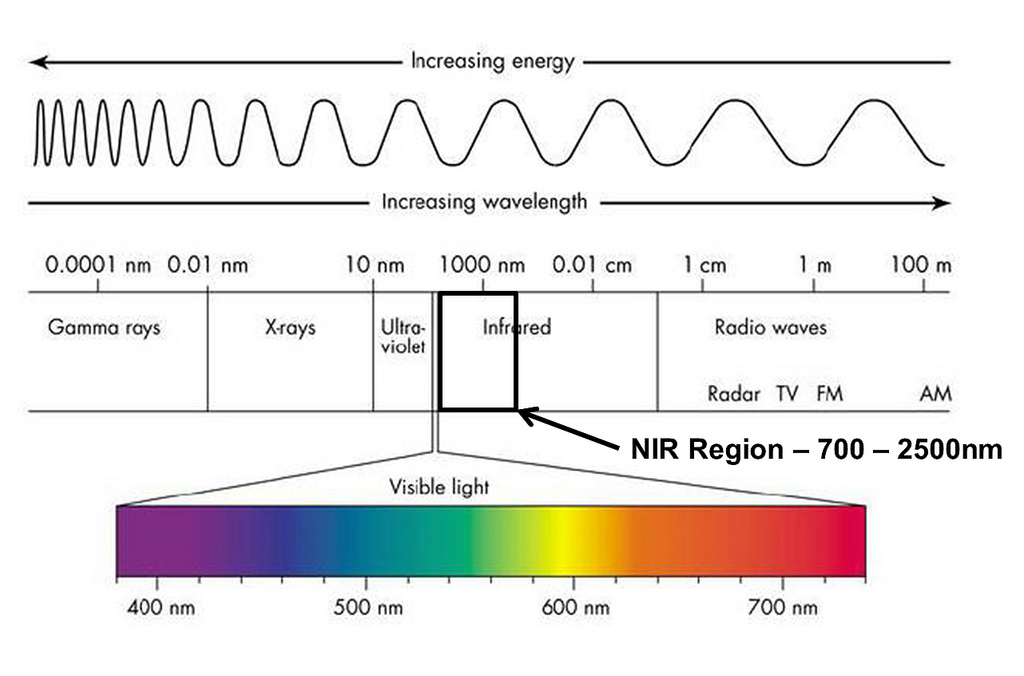
When NIR light is directed at a plant or piece of fruit, specific wavelengths of energy are absorbed by the substance’s molecular structure. This interaction is unique because different chemical bonds absorb different wavelengths of light. For fresh produce, the most critical components are revealed through specific molecular signatures and by analyzing the intensity of the light absorbed, the spectrometer can quantify the concentration levels of these components within the food product.
NIR instruments measure light that either passes through the sample (transmission) or is reflected off the surface (reflectance).
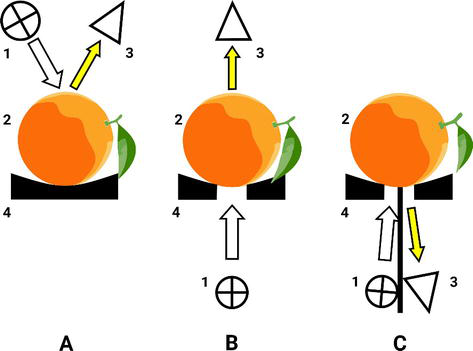
The specific measurement method is chosen based on the commodity being examined and what is being measured. For example, DA meters use only Reflectance measurement methods to see chlorophyll content on the surface of the fruit.
The raw output generated by an NIR spectrometer is complex, resulting first in a high-resolution graph illustrating the intensity of absorbed light across numerous wavelengths. This raw data and graph is too complicated for easy interpretation or operational use however and more NIR tools will be further programmed to return results in specific formats and scales for the commodity or crop they are developed for.
To convert this complex spectral signal into meaningful, actionable quality metrics (such as a percentage of soluble solids or dry matter), the data must be processed using chemometric models. Chemometrics is the application of mathematical, statistical, and computational methods to extract meaningful information from chemical data.
These models are developed through extensive, initial calibration, where the measured spectra are correlated against large reference datasets that have been rigorously verified using traditional laboratory methods. This means that NIR testing tools are not automatically suited for all commodities and anyone looking to introduce this testing into their workflow will need to ensure the tools are properly calibrated to their crop types.
While the benefits of NIR are immense, successful implementation hinges entirely on accurate, rigorous calibration. Chemometric models are not universally applicable; they must be custom-built using large databases of reference samples that have been thoroughly analyzed and verified using verified traditional laboratory methods (e.g., oven drying for dry matter, refractometers for Brix). The process of model development is expensive, time-consuming, and highly specific to the product. Models often require customization for individual varieties, specific growing locations, and targeted quality traits.
Despite its versatility, current Vis-NIR spectroscopy has one primary technical limitation: it is unable to precisely estimate texture or firmness. Consequently, NIR systems must often be complemented by other measurement tools, like a penetrometer, for pressure testing.
Portable, hand-held NIR and DA meters enable QC personnel to conduct objective audits directly in the field, eliminating delays in data collection from having to conduct sampling in a laboratory. Maternity can be measured throughout a growing area without destroying or even harvesting samples. Many portable NIR tools can be used while a fruit is still attached to the plant.
After harvest, NIR sensors are indispensable for in-line sorting and grading systems within packaging houses. We have written about pack line NIR use in our packline article series. Using a portable NIR tester prior to sending fruit down the line can lead to more efficient packline use, allowing for more optimal inventory groupings that will result in more consistency and less line stops to set up more drops. Additionally NIR data will improve storage and shipping decision making, ensuring fruit with large differences in maturity and quality is not stored together.

General NIR analyzers provide a single, powerful solution for assessing a wide range of internal quality parameters simultaneously. This comprehensive profile is essential for both maturity assessment and predicting consumer acceptance, and while each of these metrics can be attained with different testing methods, the NIR reader can do it all at once. We have outlined some of the most common metrics for fresh produce below.
Degree Brix, is the industry standard for quantifying fruit sweetness, reflecting the total amount of dissolved solids, primarily sugars. NIR spectroscopy non-destructively quantifies sweetness by detecting the various bonds present in carbohydrates, which are the molecular components of sugars. NIR predictive models are successfully used for assessing Brix° across a vast array of produce, including apples, pears, kiwi, tomatoes, and citrus fruits.
Dry matter (DM) includes all non-water solids within the fruit, such as sugars, starch, lignin, pigments, and phenols. DM content is a well-established and highly reliable indicator of maturity and serves as an excellent predictor of final ripe fruit quality post-harvest. NIR spectroscopy is the only current non-destructive method capable of accurately estimating DM content.
Destructive DM content testing is conducted using the Oven Drying method where the fresh fruit is weighed before and after drying and the ratio between the fresh and dried weight is the dry matter content. Dry matter testing is used in many produce items, including apples, avocados, kiwi, mangoes, potatoes, dates, melons, blueberries and more. Crops destined for drying, like dates or prunes, rely on dry matter testing to predict their post processing yields.
Titratable Acidity (TA) measures the concentration of organic acids, which dictate the fruit’s sourness or tanginess. For optimal flavor, the balance between sugars and acids is essential. Similar to DM, NIR spectroscopy is the only non-destructive method for measuring TA to quantify organic acid compounds. The citrus, grape, and tomato growers in particular rely on TA measures to determine processing potential.
Beyond the primary flavor metrics, NIR provides rapid assessment of other essential quality traits:
As mentioned above, chlorophyll levels can be used to assess fruit ripeness, a key metric for harvest timing and storage decision making. Using an NIR tester for chlorophyll effectively functions as an objective, electronic replacement for traditional, subjective color charts. It helps more accurately assess ripeness as it eliminates the subjective nature of color assessment and provides more consistent data that is not dependent on lighting or the human eye.
In published research, chlorophyll values at harvest have been correlated with post-storage quality indices, including firmness, sugars, and acids in specific apple cultivars. The specialized measurement, calibrated to apples, provides a temporal metric for quality control, defining how far along the maturation curve a fruit is, serving essentially as a reliable pre-harvest clock. Quality assurance and harvest teams can leverage the DA meter pre-harvest to identify the optimal picking window based on storability potential, and then utilize the broader NIR system post-harvest/pre-packing to confirm that the measured sugar/acid profile meets flavor specifications.
The adoption of NIR testing and data into fresh produce quality control processes offers profound benefits that growers and marketers can see quickly:
The adoption of Near-Infrared (NIR) spectroscopy and the specialized DA meter represents a transformative shift from reactive, destructive quality control to proactive, non-destructive quality assurance in the fresh produce industry. These technologies provide objective data essential for optimizing every phase of the supply chain.
Degrees Brix measures the percentage by weight of Total Soluble Solids (TSS) dissolved in the sample liquid based on the solid’s specific gravity. 1° Brix = ~1g of sucrose dissolved in 100g of solution (fruit juice in fresh produce case). While sugars constitute the largest portion of the TSS, the soluble solids also include organic acids (such as citric, malic, and tartaric acids), soluble amino acids, and other trace compounds (minerals, fats, and flavonoids like Vitamin C and Vitamin A). The sucrose measure is only approximate due to the other dissolved substances.
Given that sugar content can represent up to 80% of the TSS, Brix is conventionally accepted as the measure of total sugar or sweetness, but awareness of the other contributing factors is essential, as their relative proportion can significantly influence the final reading. Some crops, like citrus fruits, Brix readings alone are insufficient as regulatory and commercial standards depend on the Brix/Acid Ratio.
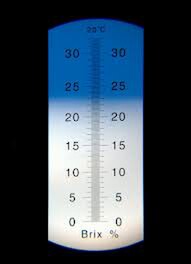
Brix is established as a mandatory regulatory standard for internal quality grading in specific high-volume fruit categories. Government agencies or industry associations assign official grades based on minimum soluble solid thresholds for crops like cantaloupe and watermelon, thereby guaranteeing a baseline quality level for consumers.
The utility of Brix extends throughout the entire production cycle, influencing critical decisions such as optimal harvest timing, grading, and processing controls. Brix provides a highly objective, inexpensive, and immediate estimate of sweetness, maturity, and processing viability.
The concept of Brix measuring and the scale used originated in the mid-1800s with Adolf Brix. Adolf Brix developed the scale using a hydrometer and was initially measuring the sugar content of grape juice for use in wine making. Though it still works to measure Brix, the hydrometer is a tool requiring precision, has many moving pieces, and is not suited for use in the field where growers need to measure Brix. Today, Brix testing is most commonly done using a refractometer.
A refractometer works by measuring how much light bends when it passes through a liquid. This "bending" or refraction changes depending on what's dissolved in the liquid, like sugar. The denser the solution, or the more TSS like sugar in the juice of a fruit, the more the light bends.

Refractometers can take a few different forms. In laboratory settings they are often stationary units that allow for multiple samples to be prepared and loaded for testing. Growers and fresh produce quality checkers will often use portable manual or digital refractometers.

Refractometers generally follow the same steps to use whether the results are manually read or digitally displayed.

Brix testing will impact decisions about packing, shipping and sales as Brix° degree measures are used in the grading processes of many fresh produce items. Standard acceptable ranges for specific crops and grades are typically set by governmental inspection agencies like the US Department of Agriculture (USDA) or the Canadian Food Inspection Agency (CFIA).
Brix testing will also greatly impact logistic decision making about harvest timing, storage and processing. Sugar levels are a contributing maturity and taste factor, informing how long produce will store or whether it will be too sour to be eaten fresh and should be sent for processing. In this section we will briefly outline how Brix° levels impact several example crop types.
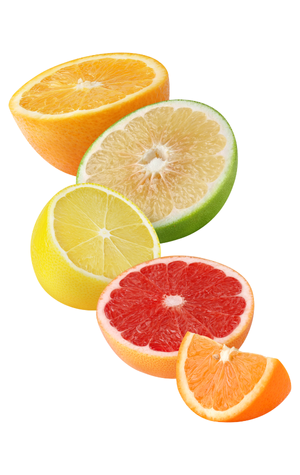
Citrus fruits are non-climaratic, meaning once picked, they will no longer develop sugars and the Brix levels will not increase during storage. Citrus is high in acid, making a Brix reading alone unreliable for determining acceptable levels of sweetness/tartness. Acid and Brix ratios must be sampled to determine the appropriate market. For example, oranges must meet a brix level of 10.5° to become unsweetened juice. These standards help ensure consistent taste for consumers.
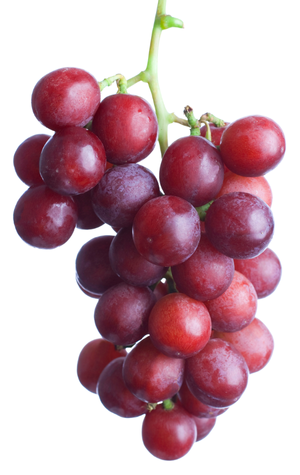
Grapes, particularly those destined for winemaking, represent one of the oldest uses of Brix measurement. Brix measurement is a key element of quality assessment throughout the winemaking process. Brix° levels are utilized to determine the optimum harvest time because the TSS content serves as the primary predictor of potential alcohol content after fermentation. For fresh market table grapes, high sweetness is highly valued, with preferred consumer Brix targets reaching 20°.
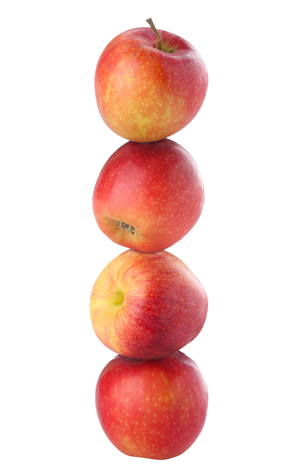
For apples, the ideal Brix levels will vary depending on the variety. Predictably, tart apples like a Granny Smith will have a lower ideal Brix than a sweet apple like a Golden Delicious or Honeycrisp. On average, most apples are ready to eat when their Brix level is around 13°. However, apples are climacratic, meaning they will continue to convert starch to sugars after they are picked and will have a higher Brix levels if allowed to ripen.
To ensure apples are available year-round, they are often placed in long-term, controlled atmosphere storage facilities. This process drastically slows down the ripening to help them last. Leading up to and after harvest, growers test Brix levels along with other maturity indicators, like pressure and starch content, to determine whether the fruit will last in storage, should be packed for immediate sale, or is too mature and needs to be sent for processing. Monitoring Brix levels leading to and just after harvest will greatly impact storage and packing decisions for apples.
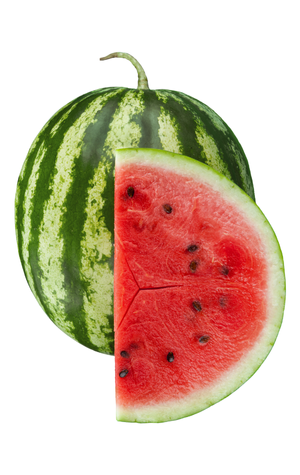
Cantaloupe, honeydew and watermelon all have minimum Brix levels set by the USDA to meet standards for sale.
Melons will be monitored in the field leading to harvest to make sure they reach acceptable levels to be sweet enough when they reach the customer.
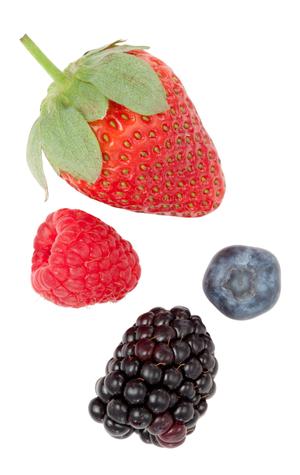
In berries, Brix can vary significantly and generally only sweet berries are considered acceptable for fresh eating by consumers. For example, strawberries or raspberries ideal Brix range is from 12°-14°, when the sugar content is lower than this the berry is considered too sour and will be sent for processing into juice, preserves or dried products.
Like in apples, Brix is often used as a harvest timing metric for blueberries. Monitoring Brix can indicate environmental stress. While sugars accumulate during ripening, cellular respiration constantly consumes these soluble sugars and converts them into acids, predominantly citric acid. Warm day and night temperatures accelerate the respiration rate. Blueberries harvested during warmer periods tend to have lower Brix values and higher acid content, leading to a sourer berry. Growers will monitor Brix and upcoming temperature forecasts to try and schedule harvest at the ideal time, allowing the berries to grow as much as possible on the bush without losing quality.
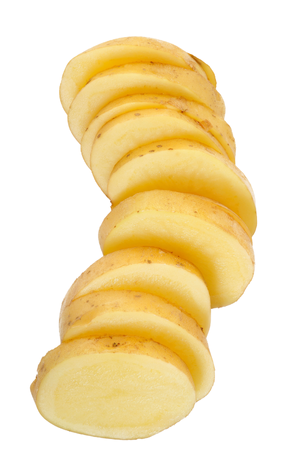
While Brix is overwhelmingly used to measure sweetness, sometimes sweetness is not the goal. Potatoes provide the clearest example of Brix functioning as a negative predictor of quality defects rather than a positive measure of sweetness. For raw potatoes destined for processing into high-heat products like French fries and chips, the industry actively seeks a low Brix reading, typically under 5°. Higher sugar levels in a potato means it is more susceptible to browning when heated and will not cook properly.
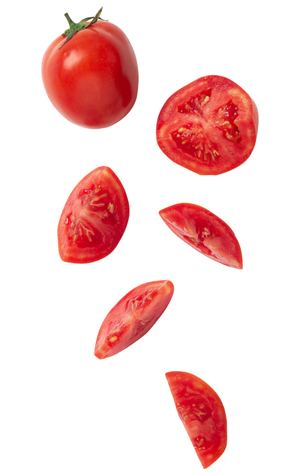
Tomatoes have different brix standards depending on their intended use. For processors making tomato paste or sauces, high Brix means there are more solids in the tomato and it will take less time and energy to reduce the liquid content. For fresh eating tomatoes, there is a broad range of standard Brix levels depending on the variety, growing region and consumer preference. Fresh market tomatoes measured in locations like Florida typically exhibit a low range of 4.1° to 5.3°, although sweeter types like cherry tomatoes can reach 5.0° to 8.0° Brix. However, the preferred consumer taste target for high-flavor tomatoes is significantly higher, around 12°
Brix readings are a good way to measure the total amount of sugar in a fruit, but they don't tell the whole story. You can't just use Brix to know if a fruit will taste good or if it's healthy. It's only one piece of the puzzle and should be used with other tests.
One of the biggest mistakes people make is thinking a high Brix number means a fruit will taste really sweet. For example, a lemon can have a high Brix level due to a high level of TSS, but it is only partially made up of sugars, there is also a high acid content. Just because a fruit has a high Brix doesn't mean people will like the flavor. Acids can make a fruit taste very tart, even if it has a lot of sugar.
Brix readings also vary a lot, even within a single lot of fruit. Brix levels will vary depending on temperature, where the fruit is grown, how much sunlight it was exposed to, ect. It is useful to vary sampling and monitor Brix from various areas of the growing area before harvest and track Brix rates over time. Standardizing and recording Brix° readings in an organized and easily reportable format goes a long way to help view Brix in conjunction with other necessary quality metrics like.

Brix is an indispensable tool in modern agriculture, providing a quick, objective, and cost-effective way to gauge the maturity, quality, and processing viability of fresh produce. From field to fork, monitoring Brix levels helps ensure a consistent and desirable product for both consumers and processors. By understanding its strengths, like its use in quality grading and harvest timing, and limitations, like its inability to tell the whole story of a fruit's flavor, growers and distributors can make smarter decisions, ultimately reducing waste and improving the overall value of their crops.
Connect all your farm's data from seeding to shipping and sale with the Croptracker API.
Link key information from all your platforms together.
Streamline your operations, reduce manual effort, and ensure your data is always accurate and up-to-date.
Croptracker’s API offers open endpoints, detailed documentation, and custom integration support.
Stop double entering data:
Automatically pull data to your custom ERP and eliminate the need for manual data entry.
Save time and reduce the risk of data entry errors.
Create a unified data view:
See all your data in one place to make better informed decisions.
Improve processes at your own pace without sacrificing organization.
Eliminate paper & mistakes:
Automate data entry and reporting.
Get rid of paper records by capturing and combining digital data from all parts of your operation.
Generate & share reports easily:
Ensure every team member has the info they need.
Automatically generate and send reports to the right people at the right time.
Let our expert staff walk you through the Croptracker system, and answer any questions you have.
We are here to help.