Last week we introduced the concept of crop load management. Crop load management can be a high-risk high-reward situation for growers. There exists the potential to maximize yield and quality, but there is a lack of concrete information on how. When it comes to pruning and hand thinning, many growers just “have a guy who’s been doing it for years”.
Chemical thinning is no simpler; temperature, weather patterns, growth stages and even variety specifications can have a huge impact on the effectiveness of chemical thinning processes. Chemical thinning may occur at a few different points during the season, but the window for the perfect application may be as short as just a few days. Traditionally, growers may use experience, manual bud, flower, or fruitlet countings, or just “eyeball it” to determine whether a second or third thinning application is needed, and they will time it according to season and their best judgement.
Studies show that the effectiveness of chemical thinning varies strongly based on weather and temperature conditions, and various conditions affecting a tree may have a huge impact on the effectiveness of a spray. Chemical applications can be expensive, and there are limits to the number of applications in a season, so timing these treatments right can be critical to managing crop load. In apples especially, which have a tendency to bear biennially rather than annually if not managed properly, this is even more important, overcropping a tree one year may have disastrous consequences the next.
So how can orchard managers make informed decisions on chemical thinning? Over the last several years, agricultural scientists have been studying data-driven thinning models to tell growers when and how to thin.
Setting the Targets
The first step before applying any growth models is to determine the desired yield per tree or per block. Two methods are used to determine the number of apples that a tree should produce, either by measuring the trunk and calculating the ideal load for a tree of that size and variety, or by working backwards from a desired cropload based on the tree’s history.
Trunk Diameter Method:
Say we have a Fuji Apple tree with a trunk diameter of 7cm, using the Ontario Ministry of Agriculture and Rural Affairs guidelines, at a trunk diameter of 7cm with a cross-sectional area of about 38 cm2, the ideal crop load recommendation for this variety is about 192 apples on this tree.
Desired Yield Method:
The formula to calculate the desired yield for a block is as follows:
Fruit/tree = Desired yield (bu/acre) x desired tray size ÷ trees/acre
For example, if we have a block that we expect to produce 1000 bushels of 88-count apples, and we have 1000 trees to an acre, our formula would look like this:
1000 x 88 / 1000 = 88 apples/tree
We’ll take a look at some of the physical tools growers use to measure their trees and determine optimal yield in our next installment, so stay tuned.
Pollen Tube Model
Starts collecting data at King Bloom. Provides Guidelines for bloom thinning sprays.
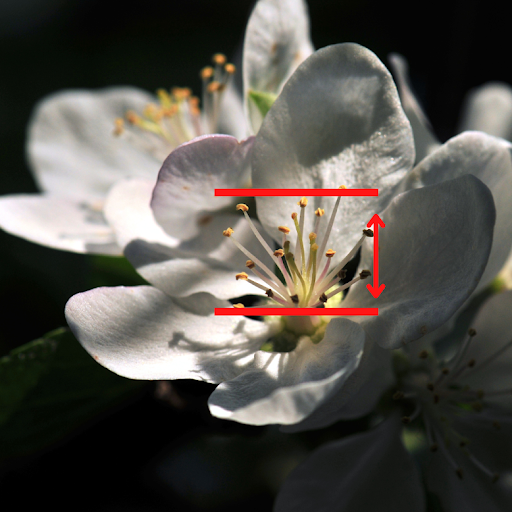
The pollen tube growth model uses temperature and weather data to determine ideal application times for chemical applications. Focused exclusively on the flower rather than looking at buds or fruitlets, it is assumed at this stage that the number of king blooms on the tree will be roughly equal to the number of fruit. Sprays at this point typically target the pistil of the flower and prevent pollination. The effectiveness of these sprays is heavily influenced by temperature. Blossom samples are taken from the trees and the styles are measured to determine the average length. Hourly temperatures are used to calculate how quickly the pollen tube is growing. Sprays will be most effective when the pollen tube is approximately the full length of the style, but cold weather can reduce the effectiveness of sprays at this time.
Pollen Tube: The Tools
Once the average style length is determined, the pollen tube model doesn’t require too much in terms of blossom counting but needs access to up-to-the-hour weather station data. The Network for Environmental and Weather Applications (NEWA) offers a pollen tube growth model calculator. A weather station is selected, a few block details are added, and the average style length as measured is entered. From here, NEWA creates a graph tracking the growth of the pollen tube, and growers can time their sprays for around 95-100% tube growth to ensure the most effective treatment.
Carbohydrate Model
Starts collecting data at the green tip, and provides guidelines for general thinning.
The carbohydrate growth model assumes an energy economy of sorts that exists in a tree. Based on temperature and weather patterns, the carbohydrate growth model predicts the daily carbohydrate balance available to a tree. This model uses weather tracking to determine energy balance, tracking three main factors: daily maximum temperature, daily minimum temperature, and daily solar radiation. Based on these factors, the daily available carbohydrates are estimated. In the simplest terms, more sunlight means more carbohydrates, but higher temperatures mean more carbohydrate consumption. Thinning is most effective when the energy available is low, so the carbohydrate model can be used to most effectively time sprays, and guide application rates.
Carbohydrate Model: The Tools
NEWA also has a carbohydrate growth mode calculator, as does Malusim. Both these free online tools use weather station data to determine the available carbohydrate balance in a tree for a four-day period. Using the NEWA calculator, the only information required to start is the green tip date and the percentage of spurs on the tree that are flowering. The model can calculate the bloom date in the future, or it can be manually entered at bloom. As degree days accumulate, the daily carbohydrate balance is calculated and NEWA creates daily recommendations on whether thinning will be more or less effective, and how to adjust sprays for the most effective treatments.
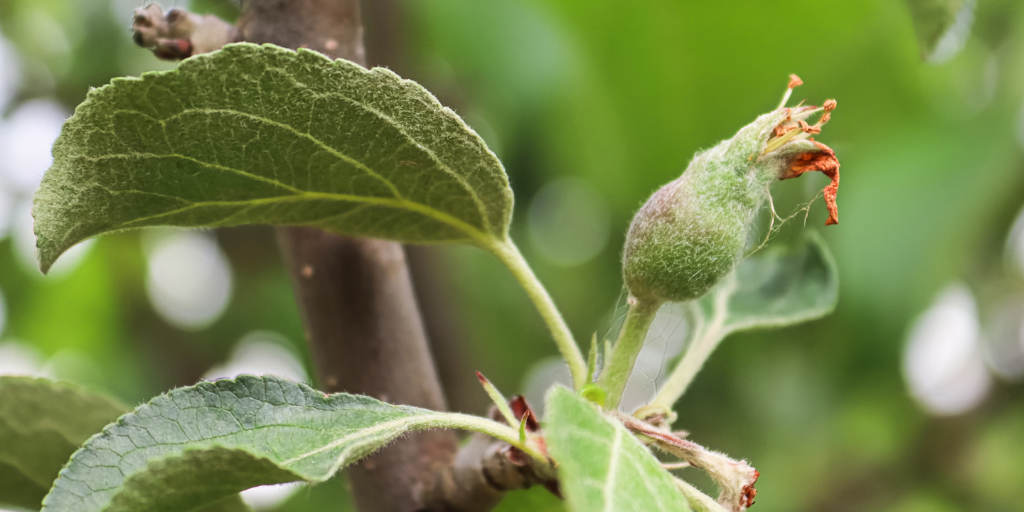
Fruitset Model
Starts collecting data at fruitset, and provides guidance for post-bloom thinning.
The fruit set stage occurs after petal fall, when fertilization has already occurred and the fruits have started to form. The theory of fruitset relies on a premise that fruitlets behave as individual living organisms that have to compete for energy. A tree’s energy comes mainly from photosynthesis, so poor weather conditions can have a strong effect on fruitlet growth. Returning to the metaphor of an energy economy, when fruitlet energy demand exceeds supply, some fruitlets will grow more slowly, and be more likely to drop. The fruitset growth model, developed at the University of Massachusetts, suggests that by comparing the size in millimeters of fruitlets, growers can determine which are more likely to abscise or fall off, and which will set and remain on the tree. According to this model, an energy crisis typically occurs when fruitlets reach about 10mm in diameter. This is the time when chemical thinning will have the greatest effect.
Fruitset: The tools
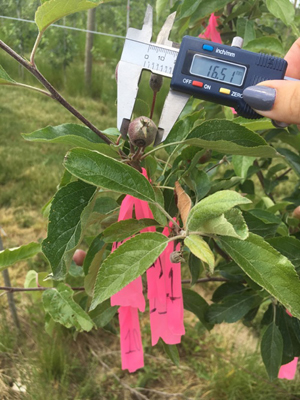
The fruitset model requires quite a bit of setup. First, a sample of trees is selected, and the flower clusters per tree are counted. Fifteen clusters are selected per tree that are marked and numbered. These will be measured later with calipers. The desired yield of the tree is determined, and from here, the percentage of fruit on the tree needed for that desired yield is calculated from the flower cluster count. Fruitlets are measured after application of a first treatment, and left to grow for 100-130 days before measuring again.
From here, growers will make use of a calculating tool like Malusim, or one of the free fruitset model spreadsheets available through many university and research programs. The tools may vary, but the results should show the predicted percentage of fruits that will set out of the originally measured fruitlets. From this information, growers can determine whether a second spray is necessary; if the predicted fruitset % is within 5-10% of the target yield, then another spray may not be necessary at all.
Precision agriculture is a complex topic that involves a lot of data collection and interpretation, and this week’s article was a lot of math. Let Croptracker handle the math for your sprays with built-in tank mix calculations, chemical inventory tracking, and over a dozen spray and chemical use reports. Track equipment in Croptracker and easily select sprayers, output rates, and specify safety equipment for your applicator with just a couple of clicks. For the next article in our series on precision crop load management, we’ll take a step back from the models and take a look at some of the physical tools growers can use in the orchard, from rulers to rings to the “rule of thumb”, to guide their thinning decisions.
Croptracker develops agtech solutions for industry leaders. Located in Eastern Ontario, Canada, our mission is to make crop production safer, more efficient, and more profitable. Designed in partnership with fresh market producers and distributors, every tool we create is based on direct industry feedback. Croptracker’s award-winning farm software optimizes recordkeeping, labor tracking, production and cost management. Our integrative Harvest Quality Vision technology offers instant empirical analysis of crop samples exactly when you need it. Optimize your harvest season with Croptracker’s customizable solutions. Visit Croptracker.com to learn more about our products and to contact us about app based solutions.