
January is the month when last season's numbers are still fresh and next season's budget is unwritten. That's the window to ask the question that actually drives this decision: can I tell which block is losing me money?
If you can't answer that yet, you're planning next year's blocks on gut feel. This article is the cost-review document that closes the gap — a five-step ROI calculation, what farm management software actually costs, a block-level cost of production method you can defend, and an honest gate for when the spreadsheet is still the right tool.
If you haven't read what's inside a farm management system, start here: What Is Farm Management Software?. This piece assumes you know the category and goes straight to the math.
Is Farm Management Software Worth It? The Honest Answer
The honest answer to "is farm management software worth it?" is that it's a math problem. It's worth it when the hours it gives back, the errors it avoids, and the decisions it improves outweigh the subscription cost. For most specialty crop operations running piece-rate crews, that math works out in your favor — usually within a season.
The real question isn't "software or no software." It's "how fast does it pay for itself, and which blocks does the math say are losing money." This article answers both.
The threshold is simple. Software makes sense when your operation crosses the point where manual tracking introduces errors, compliance risk, or administrative time that outweighs the subscription cost. For the deep dive into why spreadsheets break at scale, see Croptracker vs. Spreadsheets. This article compares the real costs, risks, and capabilities of spreadsheet-based labor tracking against dedicated farm labor tracking software.
Where the Money Is: The Labor Line Pays for the Software

Start with your biggest cost line, because that's where the ROI lever lives.
Wages and contract labor make up 40% of production expenses for fruit and tree nut operations, and 42% for greenhouse and nursery operations, according to the 2022 Census of Agriculture via USDA ERS. For all farms, the number is 12%. Specialty crops are where labor stops being a line item and becomes the business.
That line is still moving up. USDA ERS analyzed Census data from 1997 to 2022 in EB-47 (September 2025) and found total farm labor expenses increased in real terms across that span.
For specialty crops, labor is the defining cost. In a June 2023 USDA ERS review of apple picking, labor accounted for up to one-fourth of U.S. apple production costs. Washington State University Extension's 2019 cost studies, as cited by ERS, put Honeycrisp labor at 27.9% of total costs. Washington growers paid $20–$28 per bin piece rates in 2021, and pickers earned $16–$18 per hour — about 20% above the state's $13.69 minimum wage.
Piece rates pay for productivity — when they're tracked correctly, with the piece rate calculation (minimum-wage top-ups, overtime) checked every pay period.
If you run H-2A, add one more line: offered-hours compliance. Certified H-2A positions grew from about 48,000 in FY2005 to about 385,000 in FY2024 — a sevenfold jump in 19 years — and the three-fourths guarantee (20 CFR §655.122) makes offered hours a tracked, defensible number, not a memory.
The point: the software that measures your biggest cost line is the ROI lever. Everything after this section is how to do the measurement and the math.
How to Calculate Farm Management Software ROI
Here's the method. Five steps. Steps 1 and 2 are just writing down numbers you already know or can measure in one season.
Step 1: The Cost Column - Count the Real Cost (Total Cost of Ownership)
The first line of your farm management software cost vs benefits math is the true cost — not just the sticker price. Count four lines:
- Subscription — the annual plan fee, plus per-user charges above the included seat count.
- Setup time — the hours to digitize your field map, enter employees and pay rates, and set up piece rates.
- Hardware — usually the phones and tablets your crews already carry, plus an optional badge-scan clock-in kiosk.
- Ongoing data discipline — the hours your team spends keeping Work Logs, events, and inventory current.
We'll put real numbers on these in the cost vs benefits section below. For now, know that the cost column is small and countable.
Step 2: The Benefit Column - Quantify the Benefits
The benefit side has three defensible buckets:
- Administrative time reclaimed — the hours payroll, tallies, and data entry eat in peak harvest.
- Error and compliance costs avoided — missed piece-rate top-ups, minimum-wage shortfalls, audit scrambles.
- Revenue-side gains — the yield, grade, and block contribution shifts that show up once you can see block-level cost of production.
Your annual benefit is the sum of what you can defend in those three buckets. If you can't put a number on it, leave it off the sheet. This math only works with defensible numbers.
Step 3: Run the ROI Formula
With both columns in hand, the farm management software ROI formula is one line:
ROI % = (Annual benefit − Annual cost) ÷ Annual cost × 100
"Annual benefit" is your Step 2 total — time reclaimed plus errors avoided plus revenue-side gains. "Annual cost" is your Step 1 total cost of ownership.
One rule: match the time windows. Use a 12-month cost against a 12-month benefit. In a seasonal operation, either annualize the season (a 12-week harvest ÷ 52 weeks) or run the math per season and say so.
Step 4: Calculate the Payback Period
The farm software payback period tells you how fast the subscription earns back its own price:
Payback period (months) = Annual cost ÷ Monthly benefit
Payback inside the first season is the standard for operations that cross the threshold. If yours runs past 12 months, ask what the data does for you that paper can't. The answer is usually year-over-year block history — and Step 5 is where that lands.
Step 5: Recalculate Every Season
Run this math again at the end of every season, and watch what happens: the ROI gets better with every pass.
Block-level cost and yield history compounds. Year-over-year comparisons are impossible to reconstruct from scattered paper and spreadsheets — but they build automatically once your blocks are mapped and your Work Logs are captured. The baseline paper can't build is the moat, and it gets stronger every season.
Farm Management Software Cost vs Benefits: What Goes in Each Column
Now the two columns, with real numbers. Swap in your own rates and hours, and the structure holds.
The Cost Side (Be Specific, Be Honest)
Subscription. Croptracker plans start at $3,300 USD per year, including the first 10 users -- which is typically enough for a 50-person operation, and additional licenses are available for $120 per user per year.
Setup time. You'll spend time digitizing your field map — blocks, rows, growing area, plant counts — entering employees and pay rates, and setting up piece rates. Crew training is light: crew leaders typically learn the mobile app in the same day it arrives.
Hardware. Most operations use the phones and tablets crews already carry plus an additional tablet for use as a badge-scan clock-in/out kiosk. The mobile app is offline-first, so a block with no cell coverage doesn't break the workflow. If you want badge-scan clock-in/out, the kiosk is an optional add-on.
Ongoing data discipline. This is the cost we'll name honestly: the system is only as good as the Work Logs, events, and inventory you feed it. It's the number one reason adoptions underperform — not the software, but the habit of keeping records current. If you won't keep the data clean, the ROI math dies here.
The Benefit Side (What You Can Defend)
Administrative time reclaimed. Spreadsheet-based growers spend 10–15 hours a week in peak harvest on payroll-related admin — collecting tallies, data entry, piece-rate math, minimum-wage checks, report formatting, error fixes. Over a 12-week season, that's 120–180 admin hours (published benchmark). At a $50/hour composite owner rate (insert your own), that's $6,000–$9,000 per season — before a single field improvement.
Error avoidance (compliance liability). Under the FLSA, piece-rate earnings must meet minimum wage when converted to an hourly equivalent, and the employer owes the shortfall (DOL Fact Sheet #12). Here's what the exposure looks like in our published example: a 50-picker operation that misses one top-up calculation per picker per day carries about $4,900 in underpayment liability for that one day. Add the regional layers — California Labor Code §226.2 (AB 1513 rest-period pay) and Washington's Carranza v. Dovex (2018), which requires incidental tasks to be tracked and paid hourly even for piece workers — and one avoided liability event can equal many years of subscription.
Recordkeeping is already legally required — the question is what it costs you. 29 CFR Part 516 requires payroll records kept for three years, supplementary time and earnings records and wage-rate tables kept for two years, and production within 72 hours if the records are kept at a central office. Spreadsheets can meet this on paper. The hours and the risk live in the reconstruction under inspection.
Decision quality (revenue side). Once you have block-level cost and yield data, underperforming blocks, mispriced varieties, and over-applied inputs stop hiding. The next section shows you how to get those numbers.
Block-Level Cost of Production: The Number That Changes Decisions
The ROI number an owner-operator actually needs is this: which block is losing me money? Block-level cost of production is what makes that question answerable — and it's the denominator-driven math that every number in this article depends on.
The Denominator: Field Map Is the Block Backbone
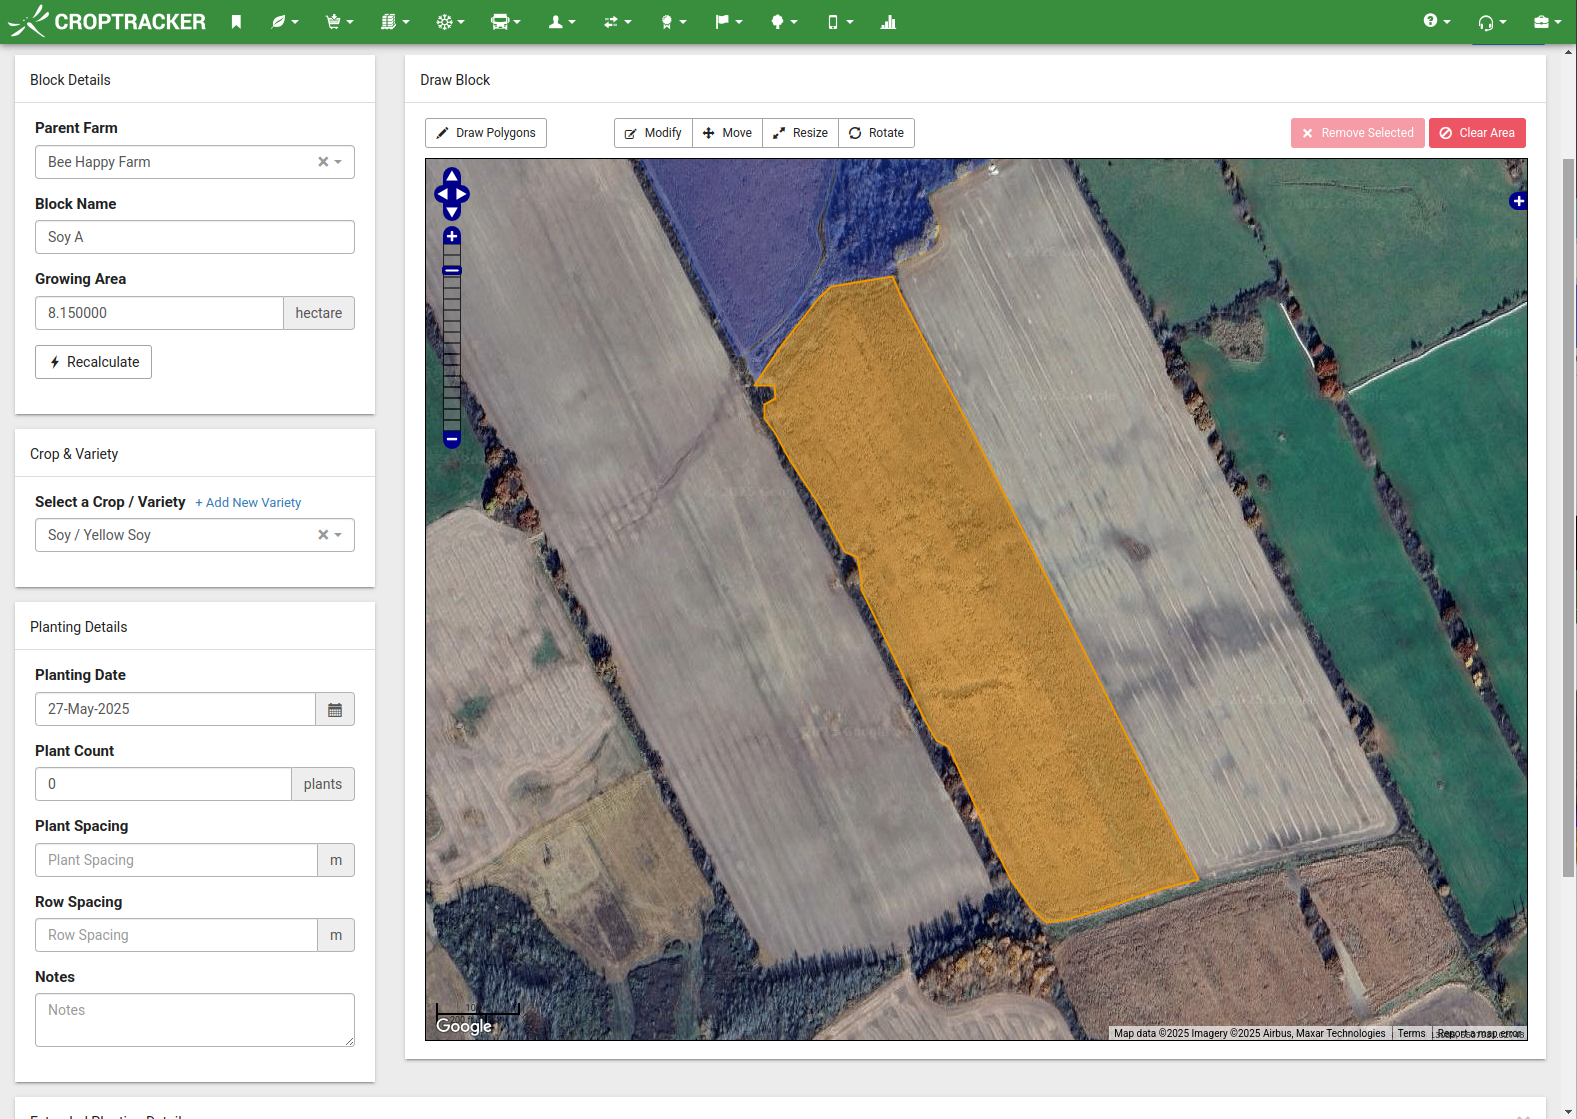
Start with Field Map. It builds GIS growing-area maps from high-resolution satellite imagery — field and row boundaries of any shape, plus hazards, irrigation zones, and borders.
Each block and row carries the data the math needs: crop and variety, seed or root stock source, row and plant spacing and counts, planting system, planting date, growing area in acres or hectares, and plant count. The model runs Farm → Block → Row, and the block is the unit every cost and yield report divides by.
Field Map supports traceability and record accuracy in all modules, and it's available to all Croptracker users. It's not an upsell, so it doesn't change your ROI math.
Why this matters for ROI: cost per acre and yield per acre are meaningless without an accurate block area. Field Map is the denominator in every ROI number in this article. If the block data is wrong, the ROI is wrong.
And the block history compounds. Replant editing preserves rotation history, and the Block Consolidated Row Planting History report shows current versus historical plantings per block — so year-over-year cost and yield comparisons get stronger every season. Paper records can't do that.
Capture Labor by Block and Activity
Punch Clock is where labor cost gets attached to a location. Crew leaders record Work Logs at the block or row with an activity type, and the worklog captures the employee's pay schedule at the moment of recording — so historical rates stay intact even if you change piece rates mid-season. Piecework and hourly are both supported.
Equipment linked to worklogs adds runtime hours × operating cost into the totals, so a block's cost carries the machine that worked it, not just the crew. Production Practice is the catch-all: it records any field task anywhere in the operation, so your cost of production has no gaps.
That's the labor side of the equation, from Punch Clock to payroll-ready reports.
Read the Cost: Total Work Cost and Cost of Spray

The Total Work Cost Report is the headline here. It combines hourly payouts, piece-rate payouts, and equipment runtime costs by location (block) and activity, and it displays Cost Per Area (acres or hectares) and Cost per Plant. Filter by date, crop type, employee, work crew, custom category, or production practice. This is the block-level cost of production report.
For the chemical line, Cost of Spray by Block breaks down per-block chemical cost from your inventory deposits.
Croptracker Analytics & Reporting covers the whole thing: 80+ reports across the operation, generated in seconds and exported in any format. Cut audit time to a few hours instead of a few days.
For the season-end budgeting baseline use the Farm Activity Cost Report for farm-level detail (or the Total Work Cost Report for block-level detail) and build historical cost baselines for next season's budget. We walk through the report filters in our breakdown of the Total Work Cost Report.
Position it this way: the reports are the ROI. The software's value is the block-level cost of production it makes computable.
Read the Yield: Block Yield Report
The other side of the division is the Block Yield Report: total volume or weight per block, with derived yield per acre (or hectare) and yield per plant. Filter by date range, planting cohort, or block on a map select, and export to PDF, XLS, or email.
It pairs with the Harvest module, which ties bin-level harvest inventory to blocks and pickers — see Harvest & Crop Yield Records. Best practice: run Block Yield at the end of each season and compare year over year.
Do the Division: Cost per Unit vs. Price = Block Contribution
Here's the two-report join that turns records into decisions:
- Block Yield Report gives you the revenue side: block yield, and your price per unit.
- Total Work Cost Report gives you the cost side: block cost of production.
Divide, and you get cost per unit against selling price per unit. The difference is the block's contribution:
Block contribution = Block revenue − Block cost of production
The supporting formulas:
Cost of production per acre (block level) = (Block labor + Block equipment + Block chemicals + Block materials + Allocated overhead) ÷ Block growing area
Cost per unit = Block cost of production ÷ Block yield (weight or volume units)
This is the number from the first paragraph — can I tell which block is losing me money? — now computed. Export the two reports to Excel for pivot analysis, and PDF for your accounting files. One framing note: Croptracker is not an accounting system. It produces and calculates the field data that you feed cleanly into the one you already run.
A Worked Example: Farm Software ROI on a 100-Acre Orchard
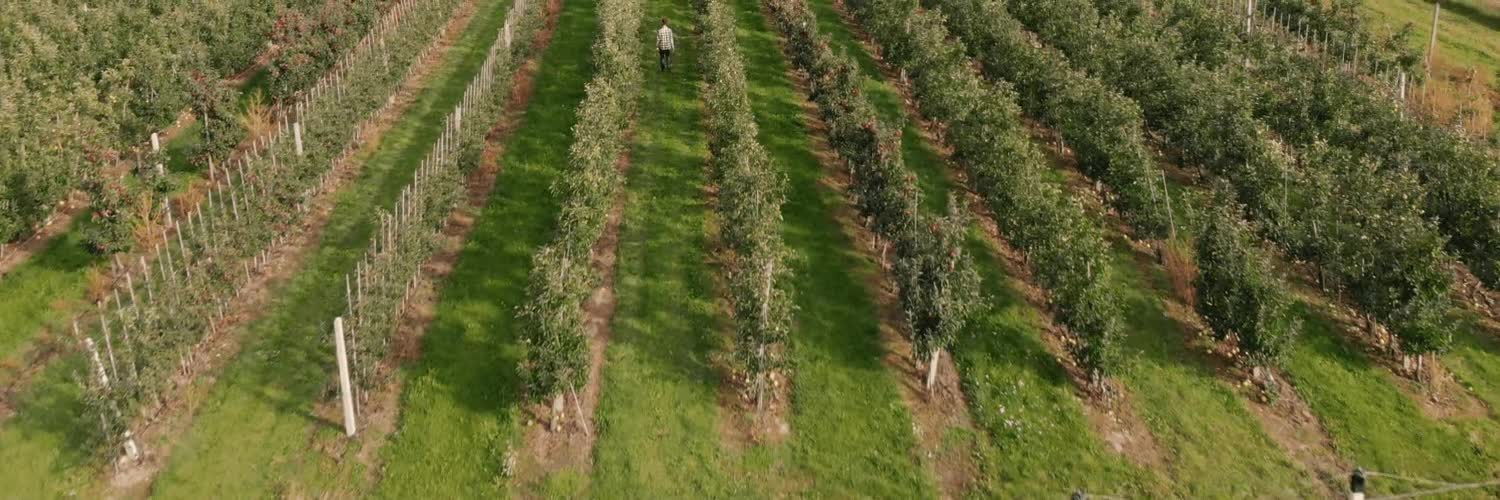
Here's the full calculation on a composite operation. This is an illustrative composite, not a customer — swap in your own numbers and the structure holds.
The setup. A mid-size specialty crop operation. 100 acres of tree fruit. A seasonal labor bill around $200,000. A 12-week harvest. Three crews.
The cost. Fifteen licensed seats: the $3,300 base (first 10 users included) plus 5 extra seats at $27.50 per month × 12, or $1,650. Total: about $4,950 a year.
The benefit.
- Administrative time reclaimed. Six hours a week × 50 working weeks = 300 hours. At a $50/hour composite (insert your own loaded rate), $15,000. In a lighter season — or at a lower rate — a realistic low end lands near $11,000.
- One avoided error event. A missed piece-rate top-up pattern caught before it becomes a liability, about $5,000. If you've ever had a missed top-up, this is your number.
That puts the annual benefit in the $11,000–$20,000 range.
The math.
- ROI. ($11,000 − $4,950) ÷ $4,950 = 120%. ($20,000 − $4,950) ÷ $4,950 = 300%. ROI ≈ 120–300%.
- Payback. $4,950 ÷ ($11,000 ÷ 12) = 5 months. $4,950 ÷ ($20,000 ÷ 12) = 3 months. Farm software payback period ≈ 3–5 months.
The compounding part. Year 2's baseline is what Year 1's paper records couldn't have given you. Block cost and yield history compounds, so the ROI of the investment improves every season — the part the one-year math can't see.
Proof at Scale — Then Scaled Down to Your Farm
Before you write the numbers off as theoretical, here's what they look like at scale.
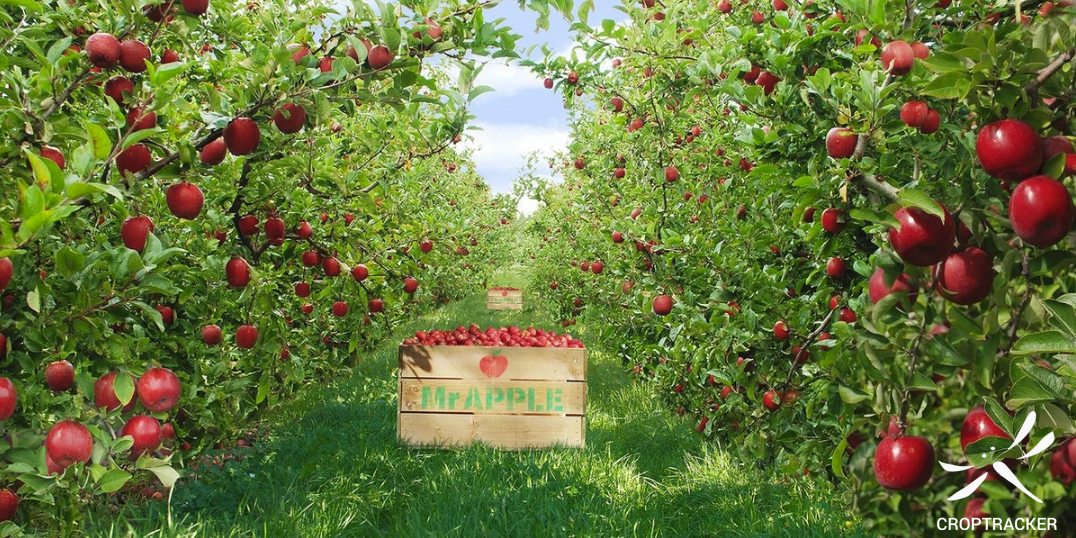
Mr Apple, New Zealand's largest fully integrated apple grower, packer, and marketer, has run Croptracker since early 2019. Their grower survey found 600–800 hours saved per week, which is over 16,000 hours saved per harvest season. Senior staff save an average of 4–8 hours per week per orchard manager. The payroll department alone saves 10 hours a week.
"It has been amazing. It has saved hours of time and effort in the field and in administration and has added a level of accuracy and traceability that we have never been able to achieve in the past. I would absolutely recommend Croptracker as a product to other growers around the world." — Grant Stevenson, Orchard Manager, Mr Apple
For scale context: Mr Apple employs 2,200+ staff at peak and exports 5M+ cartons a year. Your farm is smaller. The number to model is the per-manager one — 4–8 hours a week, back. At a $50/hour loaded rate, that's $10,000–$20,000 a year per manager. That's the number that pays for the subscription at your scale.
The same pattern shows up in audit work. Sandhar Farms puts it this way: "We save hours during audits, especially spray and GAP. I don't have to rush and stress gathering records. We just print out a report."
Payroll shows up, too. Heritage Grown now completes a payroll cycle that used to run until Friday by Wednesday afternoon — "two full days of work each payroll cycle."
When You Should Keep the Spreadsheet
The honest gate. Keep the spreadsheet when all four of these are true:
- You run a single crew of 5 workers or fewer.
- Everyone is on simple hourly pay — no piece rate, no hybrid.
- No labor audits or compliance reviews are coming.
- Your operation is stable, not scaling.
The threshold, restated: software makes sense when your operation crosses the point where manual tracking introduces errors, compliance risk, or administrative time that outweighs the subscription cost.
And even when software is the right call, start modular. Run Punch Clock alone for a season — labor tracking, payroll reports, piece-rate math — prove the ROI on the cheapest slice, then add Harvest or Spray. Croptracker pricing is per-module, so you don't buy the whole platform to test the thesis. That's the direct answer to "we're a small operation and would look at the annual cost."
One line for the other side of the ledger: the cost of the status quo is the 10–15 hours a week of peak-harvest admin and the three years of records you'd have to reconstruct in 72 hours. That's the spreadsheet's hidden line item.
Five Questions to Run Before You Buy
Before you spend a dollar, run these five. Each one maps to a line in the math above.
- How many hours a week does payroll admin actually eat in peak harvest? Multiply by your hourly rate and you have benefit line one. If you can't answer without guessing, that gap is the cost.
- What is one avoided piece-rate error worth against your subscription? DOL minimum-wage top-ups, California §226.2, Washington's Carranza ruling — one event can equal years of subscription.
- Could you produce three years of payroll records within 72 hours today? 29 CFR Part 516 is the clock. Test it before an auditor does.
- Can you name your three most profitable blocks right now? If not, you don't have block-level cost of production — and that's the gap the investment closes.
- What payback period can you accept, and which season do you hit it in? Inside the first season is a clear yes. Past a year, the question becomes what the data compounds into.
Run the numbers on your own farm. Book a private demo and we'll walk the ROI calculation on your blocks and last season's numbers.
Not ready for a demo? See what plans cost: Croptracker pricing.
References
USDA / ERS
- USDA ERS, "Farm Labor" topic page — 2022 Census cost shares (40% fruit and tree nut, 42% greenhouse and nursery, 12% all farms); real farm wages; H-2A position counts — https://www.ers.usda.gov/topics/farm-economy/farm-labor/
- USDA ERS, EB-47 (September 2025), "Farm Labor Expenses: Evidence from the 1997–2022 Census of Agriculture Data" — https://www.ers.usda.gov/publications/113431
- USDA ERS, Amber Waves (June 2023), "Advancements in Apple Picking: An Industry Addresses Tight Farm Labor Markets" — https://www.ers.usda.gov/amber-waves/2023/june/advancements-in-apple-picking-an-industry-addresses-tight-farm-labor-markets (also the citation path for Washington State University Extension's 2019 Washington apple cost studies, cited via ERS)
- USDA ERS, EIB-235 (2022), "Adjusting to Higher Labor Costs in Selected U.S. Fresh Fruit and Vegetable Industries" — https://www.ers.usda.gov/publications/104217
- NASS, 2022 Census of Agriculture — https://www.nass.usda.gov/Publications/AgCensus/2022/index.php
- USDA ERS, ARMS (Agricultural Resource Management Survey) data product — cost-of-production methodology — https://www.ers.usda.gov/data-products/arms-farm-financial-and-crop-production-practices
Regulatory
- 29 CFR Part 516, "Records to Be Kept by Employers" — https://www.ecfr.gov/current/title-29/part-516
- U.S. DOL, FLSA Fact Sheet #12, "Minimum Wage Protection for Workers Paid on a Piece-Rate Basis" — https://www.dol.gov/agencies/whd/fact-sheets/12-agricultural-employment-flsa
- California Labor Code §226.2 (AB 1513) — https://leginfo.legislature.ca.gov/faces/codes_displaySection.xhtml?sectionNum=226.2.&lawCode=LAB
- 20 CFR §655.122 (H-2A three-fourths guarantee) — https://www.ecfr.gov/current/title-20/part-655/section-655.122
- Carranza v. Dovex Fruit Co. (2018), Washington — case citation only
Internal (Croptracker)
- Croptracker pricing page — /pricing.html
- Croptracker vs. Spreadsheets: Which Labor Tracking System Actually Saves You Money — /blog/croptracker-vs-spreadsheets-which-labor-tracking-system-actually-saves-you-money.html
- Mr Apple: A Croptracker Success Story — /blog/mr-apple-a-croptracker-success-story.html
- Five Reasons Users Love the Total Work Cost Report — /blog/five-reasons-users-love-the-total-work-cost-report.html
- Croptracker Customer Showcase: Sandhar Farms Ltd — /blog/croptracker-customer-showcase-sandhar-farms-ltd.html