Driven by customer feedback, Croptracker recently developed a workflow to handle a new and significant requirement: building a full inventory of hundreds of thousands of trees on a newly acquired orchard and continuously recording their long-term health and performance. To make this goal possible, Croptracker added a new Plant Inspection workflow using our Quality Control and Field Map modules.
For perennial crop growers, plants are a long-term investment. Most perennial / permanent crops won’t produce a significant yield until several years after planting, and they will not produce at the same quality or quantity indefinitely. Predicting when an investment into planting will pay off is a complicated challenge that cannot be accomplished without an accurate plant inventory to begin with.
When planting your own orchards, the spacing and inventory of the trees is calculated in advance so the right number of plants can be ordered. However, in an agricultural landscape with increasing consolidation, it is relatively common for a new farm owner to have a less-than-perfect sense of the plant assets on their new property.
This is a prime example of Croptracker’s favourite saying “You can’t manage what you can’t measure”. Taking stock and developing systems for monitoring the productivity of these plants is a vital first step to being able to make informed decisions about their ongoing management. In this use case article we have detailed how to create plant inventory and health records over time and have outlined the benefits of this type of record keeping in Croptracker.
Plant inspection use case example
Making and labeling a plant inventory
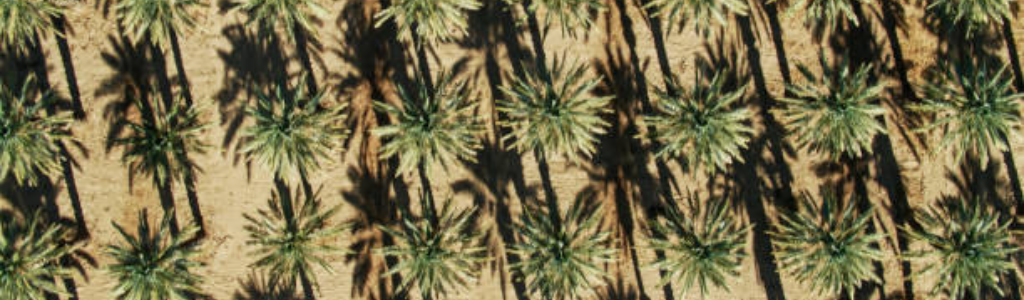
To help illustrate this use case we will use an example date farm with a vast and established planting of thousands of trees. The first task is to take stock and ensure there is an accurate count of all the trees in each area.
To do this with the Plant Inspection workflow is to create the plants and print their tags using the Field Map module. This part of the process is done with the help of Croptracker’s support team who will ensure the proper tree identification and naming conventions.
Some of the details about each planting are known by the new owners: the borders of each planting section, the year each section was planted and the variety of the trees within it. However, the number of trees in each area is unknown. Because of this, Croptracker will create more tags than trees and the remaining unused tags will be disregarded in reporting and removed when all trees are tagged.
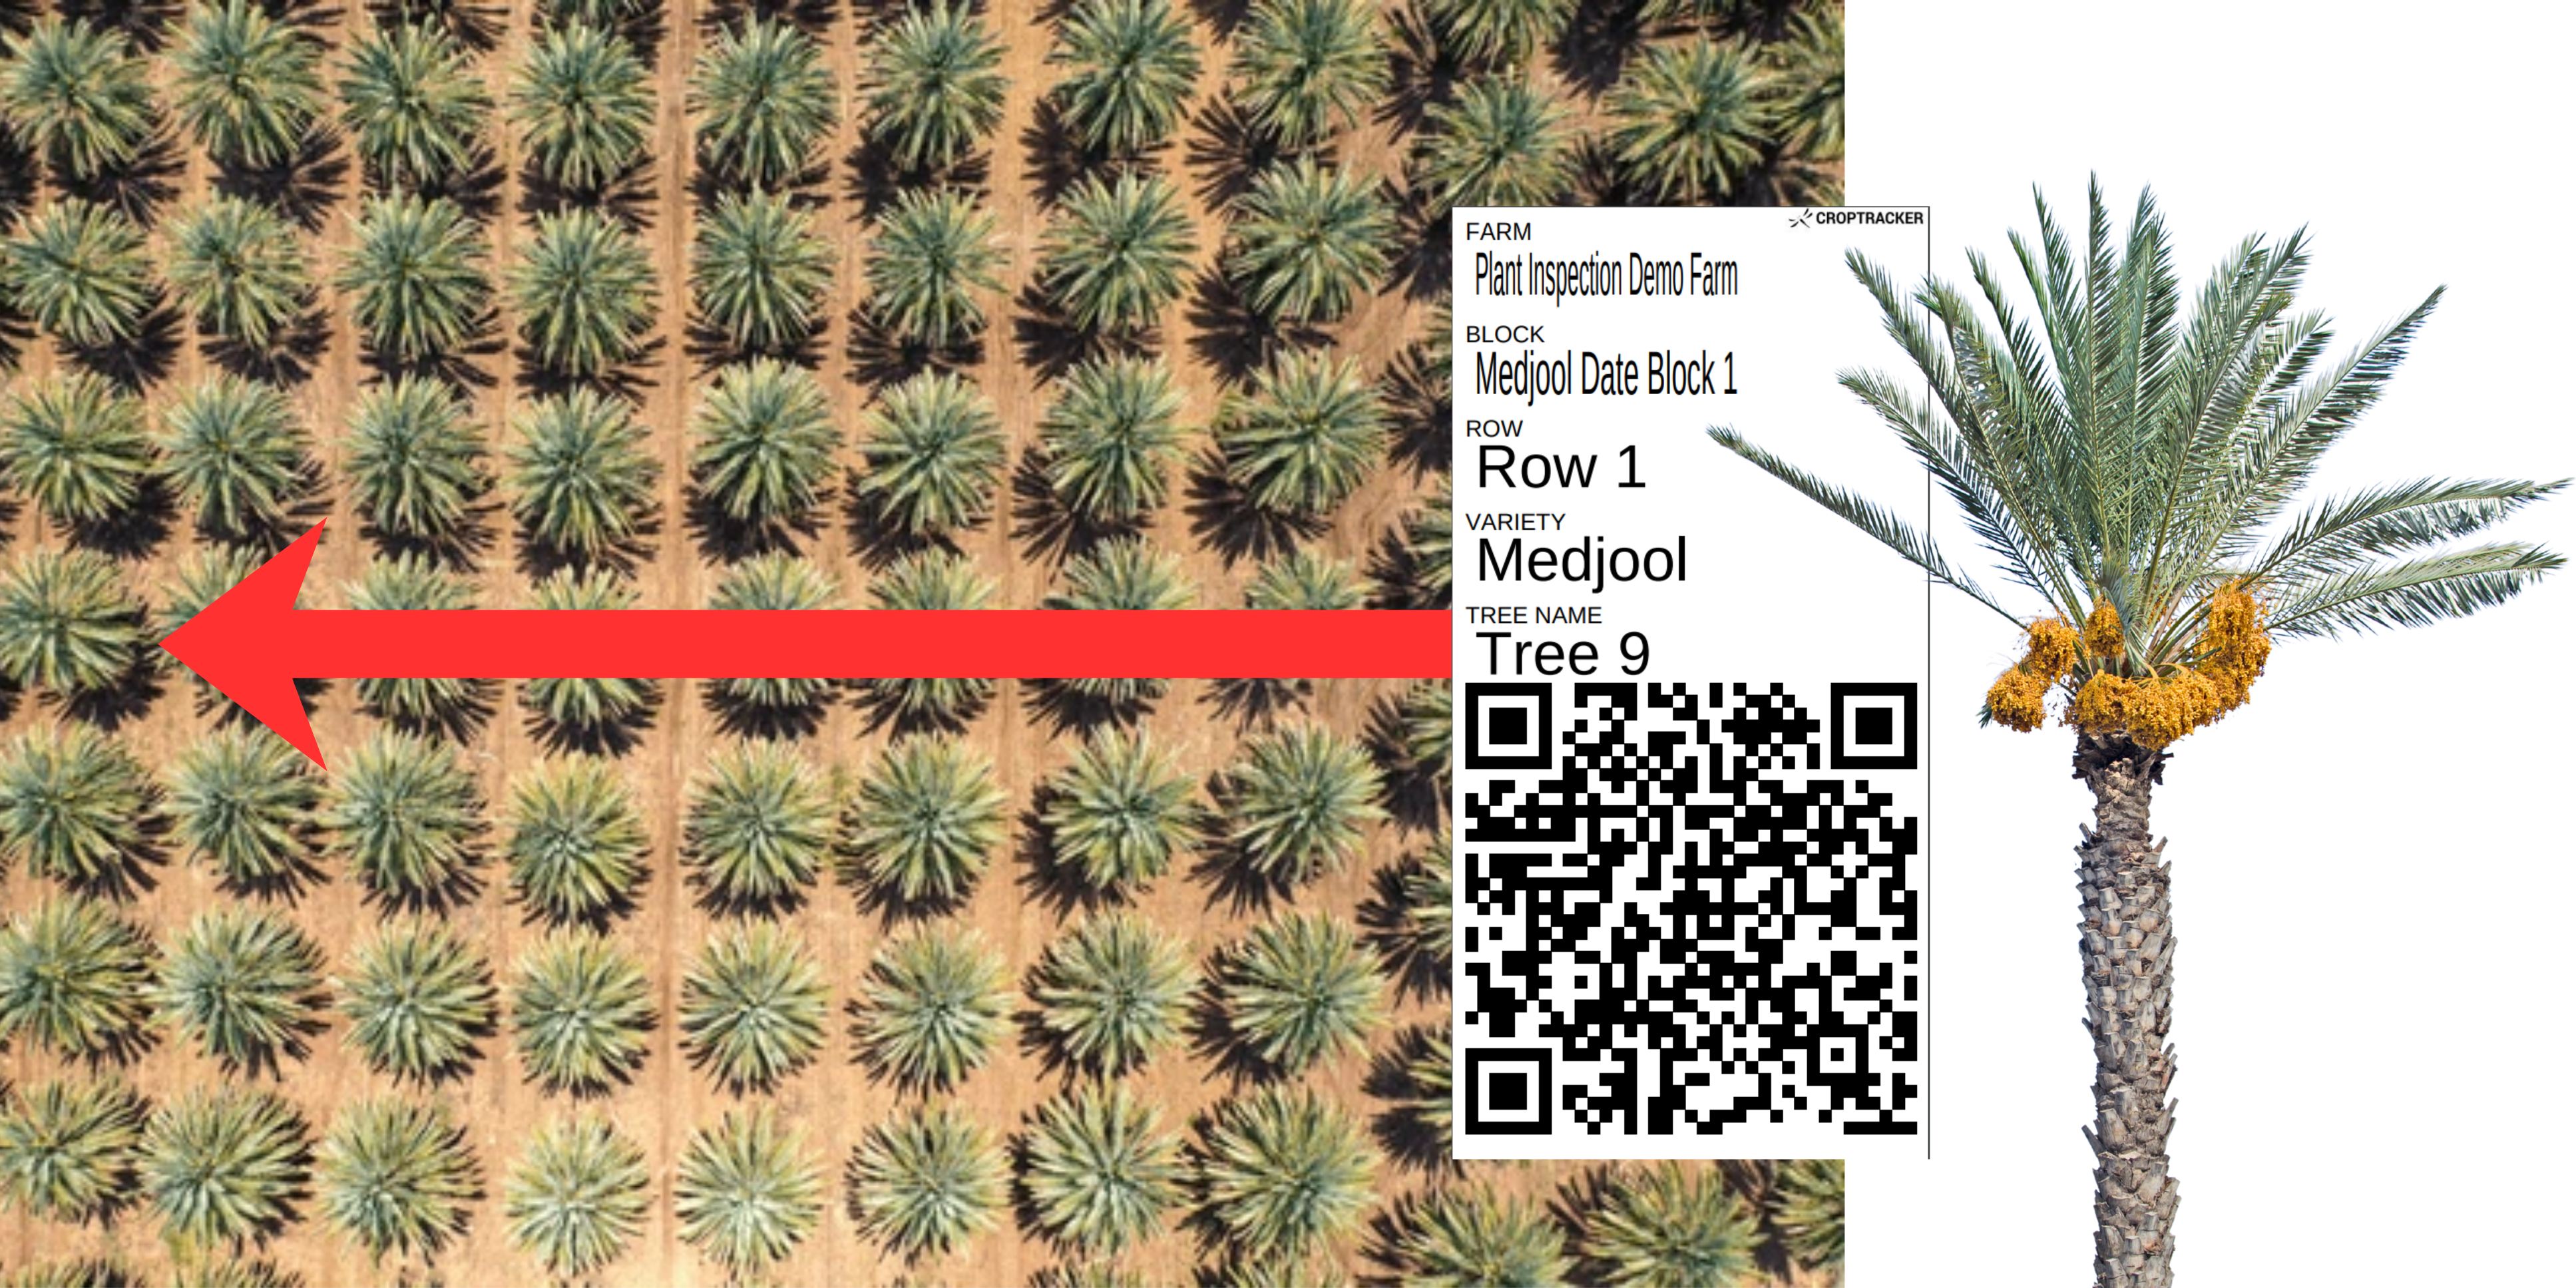
The Croptracker Field Map creates grouped plantings with a Farm/Block/Row structure. Plants are added to either the Block or Row depending on which is the lowest part of your structure. Plants can be named, though this is not necessary as each tree tag will have a unique QR code. For this example, the Plants have been added at the row level.
Once the trees have been added to their respective growing location in the Field Map, tags are printed to be attached to each tree. This means that each tree can be linked to inspection records and this information can be aggregated over time as the tree is assessed over time. Importantly, tags can be reprinted with a click so damaged tags are easily replaced.
Inspection set up
Now that trees have been added to our Field Map and we have the labels ready to go, the next step is to ensure a Plant Inspection template is set up to capture all the data needed in the first assessment.
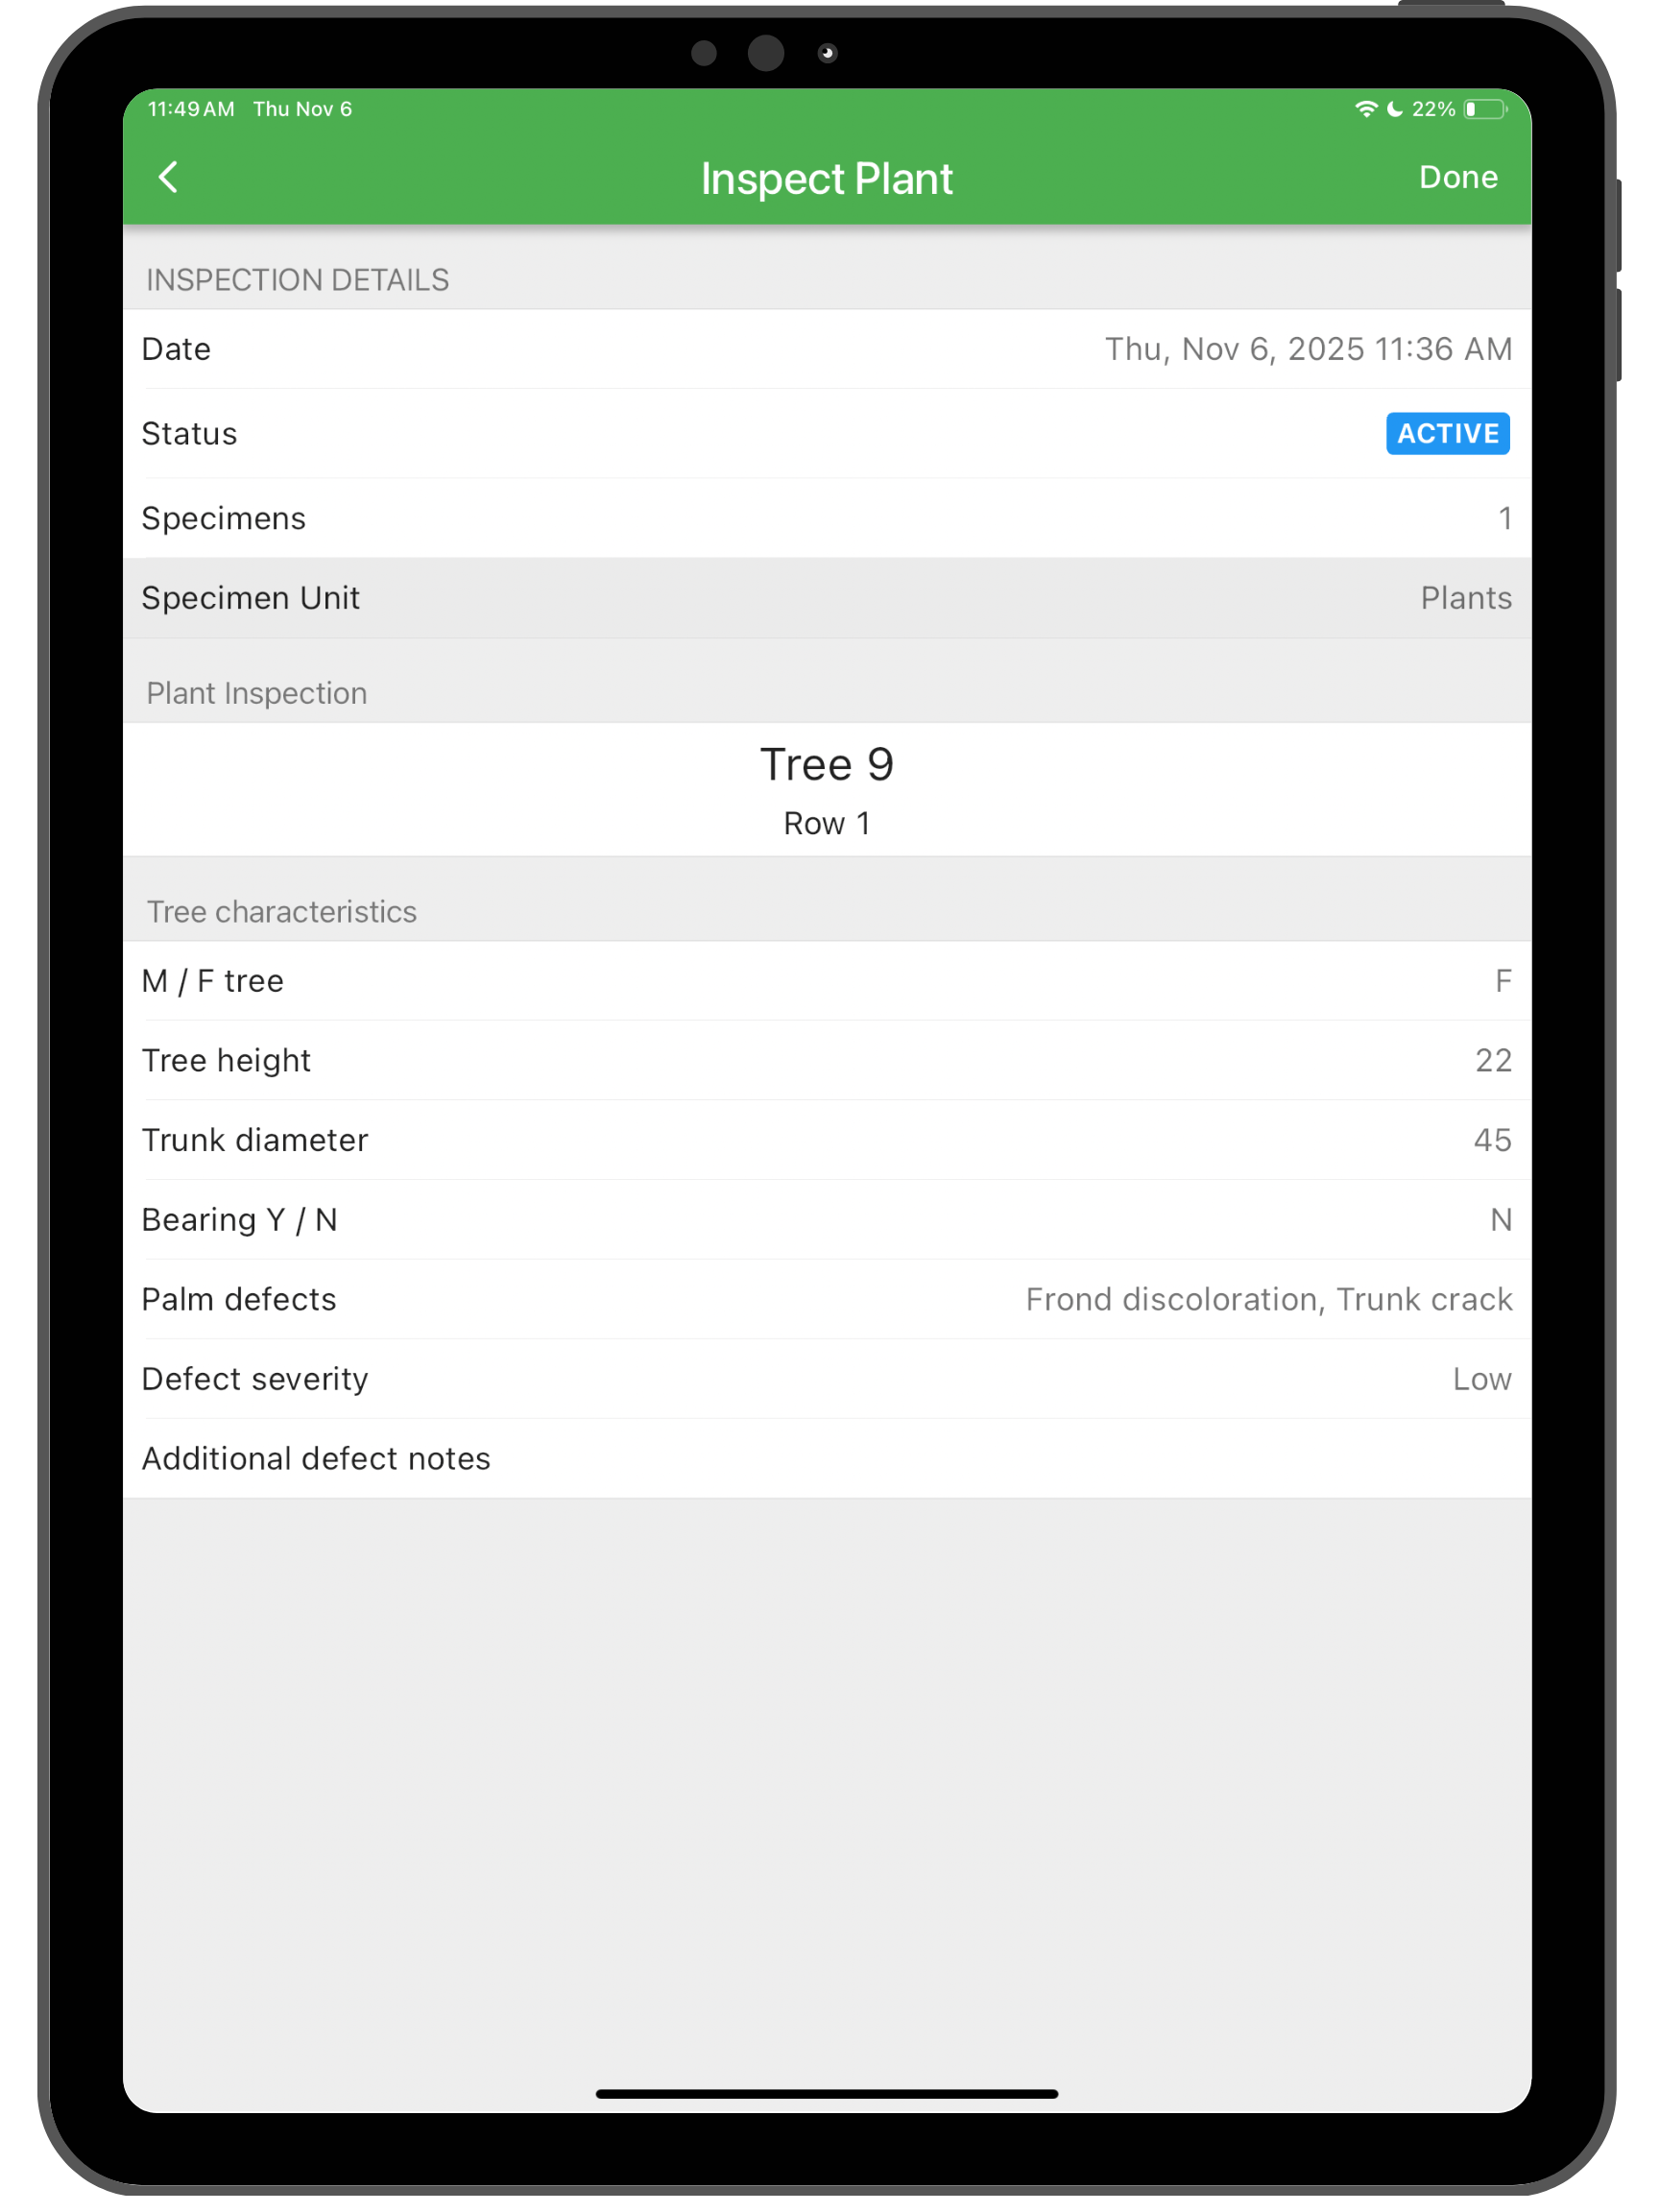
For the first assessment of the date trees in this orchard the following critical information needed is:
- Create a complete and accurate inventory of the number of trees in each section
- Determine if the tree is male or female
- The height of the tree
- The trunk diameter
- Is the tree productive? I.e., is the tree bearing fruit now?
- Are there any visible / known health issues with this tree and what are they?
- What is the severity of the health issues if present?
- Any additional notable characteristics of the tree
Croptracker support staff have worked with the farm owners to make this data easy to capture on the mobile app using an Inspection Template as seen below.
Now that the set up is complete, it’s time to head out to the orchard with the tree tags, a measuring tape and the Croptracker app.
Tagging and inspecting in the orchard
For this part of the process, several staff are sent out at once to start scouting a block and create the tree inventory by tagging each tree and logging an initial tree assessment against it. Each worker will have a stack of unique Plant identification tags for the row they are working in. In our example orchard the trees are being numbered in order so the first tree on the south side of the block will always be Tree #1.
As the workers approach a tree they will attach the next tag in the sequence and scan it to start recording their assessment details. The tree’s measurements are taken in this first assessment to ensure there is a complete understanding of the current state of the orchard. It also creates a benchmark for measuring growth in following seasonal assessments. Anytime this tag is scanned and the tree is assessed again, the historic data integrity of this particular tree is preserved.
As the season progresses, this orchard will send workers out to assess the fruit development of each tree and link this data with each tree’s tag. They will scan the tree tags again and fill out a different Plant Inspection template that lets them record if the tree is bearing fruit and its total bunch count. The goal of the farm owners is to track the productivity of each tree over several seasons to determine if it should be cut down and replaced.
When we originally started developing this workflow, we were concerned that while it would create visibility but that it would also create a potential data overload problem. With thousands of tree inspections logged on the app, this data quickly becomes hard to digest and make decisions about. That’s where the aggregate reporting on Croptracker’s web app comes into play.
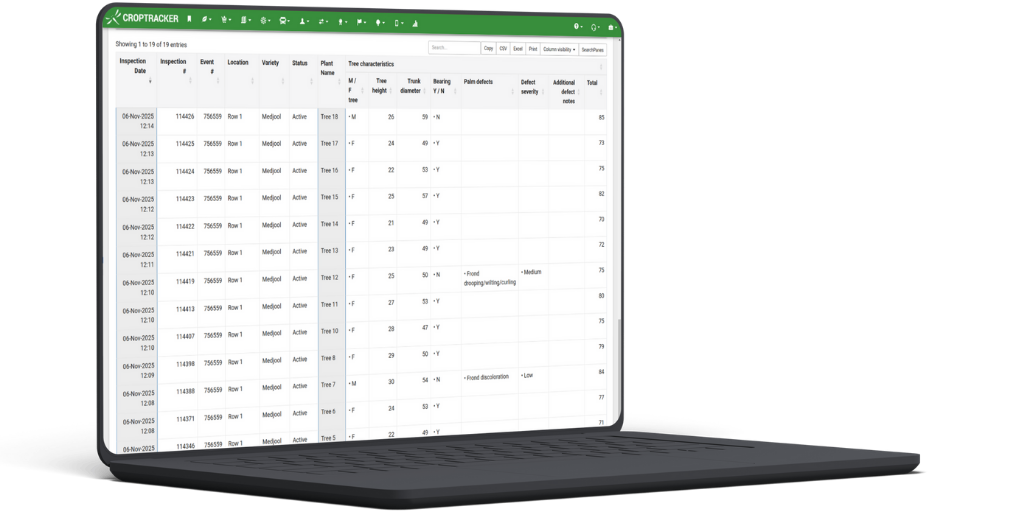
Reporting plant health over time
Using the Plant Inspection Report enables a view of each tree’s detailed information. Running this report for a specific block at a time will give a complete view of each tree in that block, which will quickly show patterns of unhealthy trees and if there is an appropriate ratio of male and female trees. As more seasons of scouting are logged in Croptracker, this report also creates a one to one comparison on tree growth and health over time.
Croptracker is also developing custom aggregate reports for Plant inspections over time. Working in close consultation with the customer we developed this workflow for, new plant inspection reporting will show block and variety level plant details to enable higher level decision making and yield predictions.
Apart from monitoring specific tree’s health and yield potential over time, plant level data is useful for several reasons. Creating a complete inventory of perennial plants can be extremely valuable for assessing farm land value and earning potential. This can help with long term farm growth planning and will inform insurance purchases. With increasing uncertainty in climate patterns, labor availability and trade dynamics, detailed knowledge of the health and potential of planted assets means decisions about their management can be responsive, informed and ultimately more profitable.
The Plant Inspection in Croptracker’s Quality Control module is flexible enough to support many other workflows. We have started working with long time Croptracker users to support in season flagged example tree scouting. This flow includes tagging representative plants throughout a growing area that will be assessed as the season progresses. These trees provide stable sampling opportunities to monitor the health and fruit development of the whole orchard, without requiring each tree is tagged. If you have more ideas or questions about how structured, plant level data can help your operation, get in touch with us at support@croptracker.com or book a demo directly on our calendar.