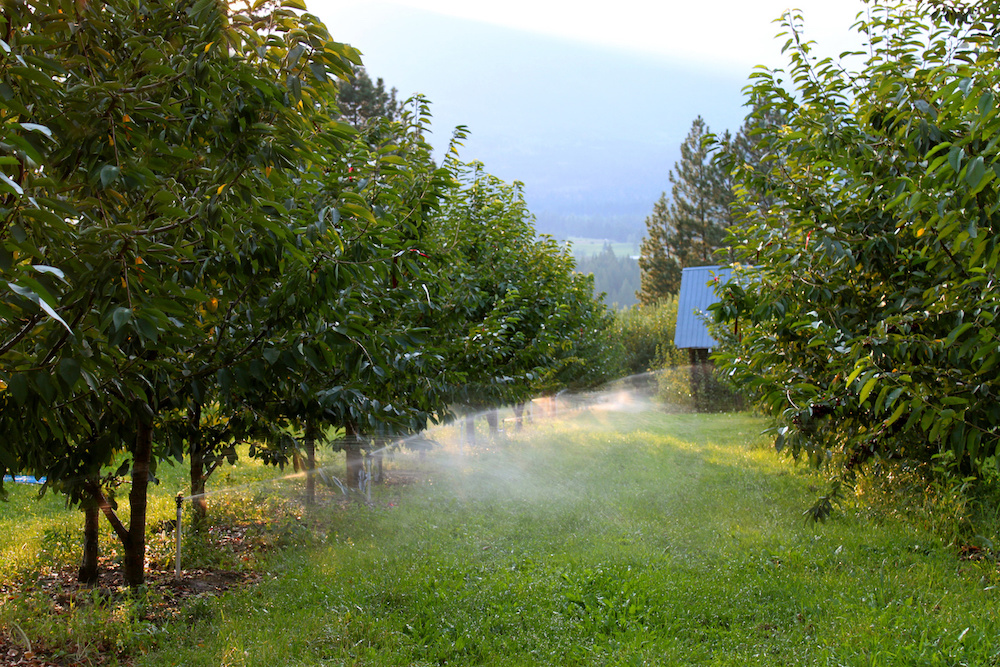
Sometimes irrigation feels like an underestimated star of horticulture. While we may not discuss it on this blog as much as we discuss chemical applications or harvests, irrigation is a critical process upon which the farm's success hinges. As growers know, irrigation not only increases yields and fruit size, but lengthens tree and vine life for a variety of fruits and vegetables.
But - especially during World Water Week - we must consider the potential costs of irrigation, both to the grower and the environment. Applying the optimal amount of water at the right time is critical to maximizing profits and maximizing crop health, while overages and underages cost the grower and damage crops. Of course, the "optimal amount of water" varies both for every crop and field location. Growers can access a wealth of resources online that advise, based on commodity type, when and how much to irrigate. But due to the aforementioned importance of location on irrigation results (one field can be no longer in need of irrigation while neighbouring fields enter their peak need for water), the saying "The best way to predict the future is to study the past" holds particularly true for growers.
Croptracker strives to make record-keeping and identifying efficient use of resources easier, and irrigation is no exception. By recording irrigation entries using the app's easy interface and then viewing historical trends using instantly-generated reports, growers can augment their scientific and intuitive conclusions regarding their irrigation plan with a big-picture understanding of past irrigations and their results.
Recording Irrigation Data
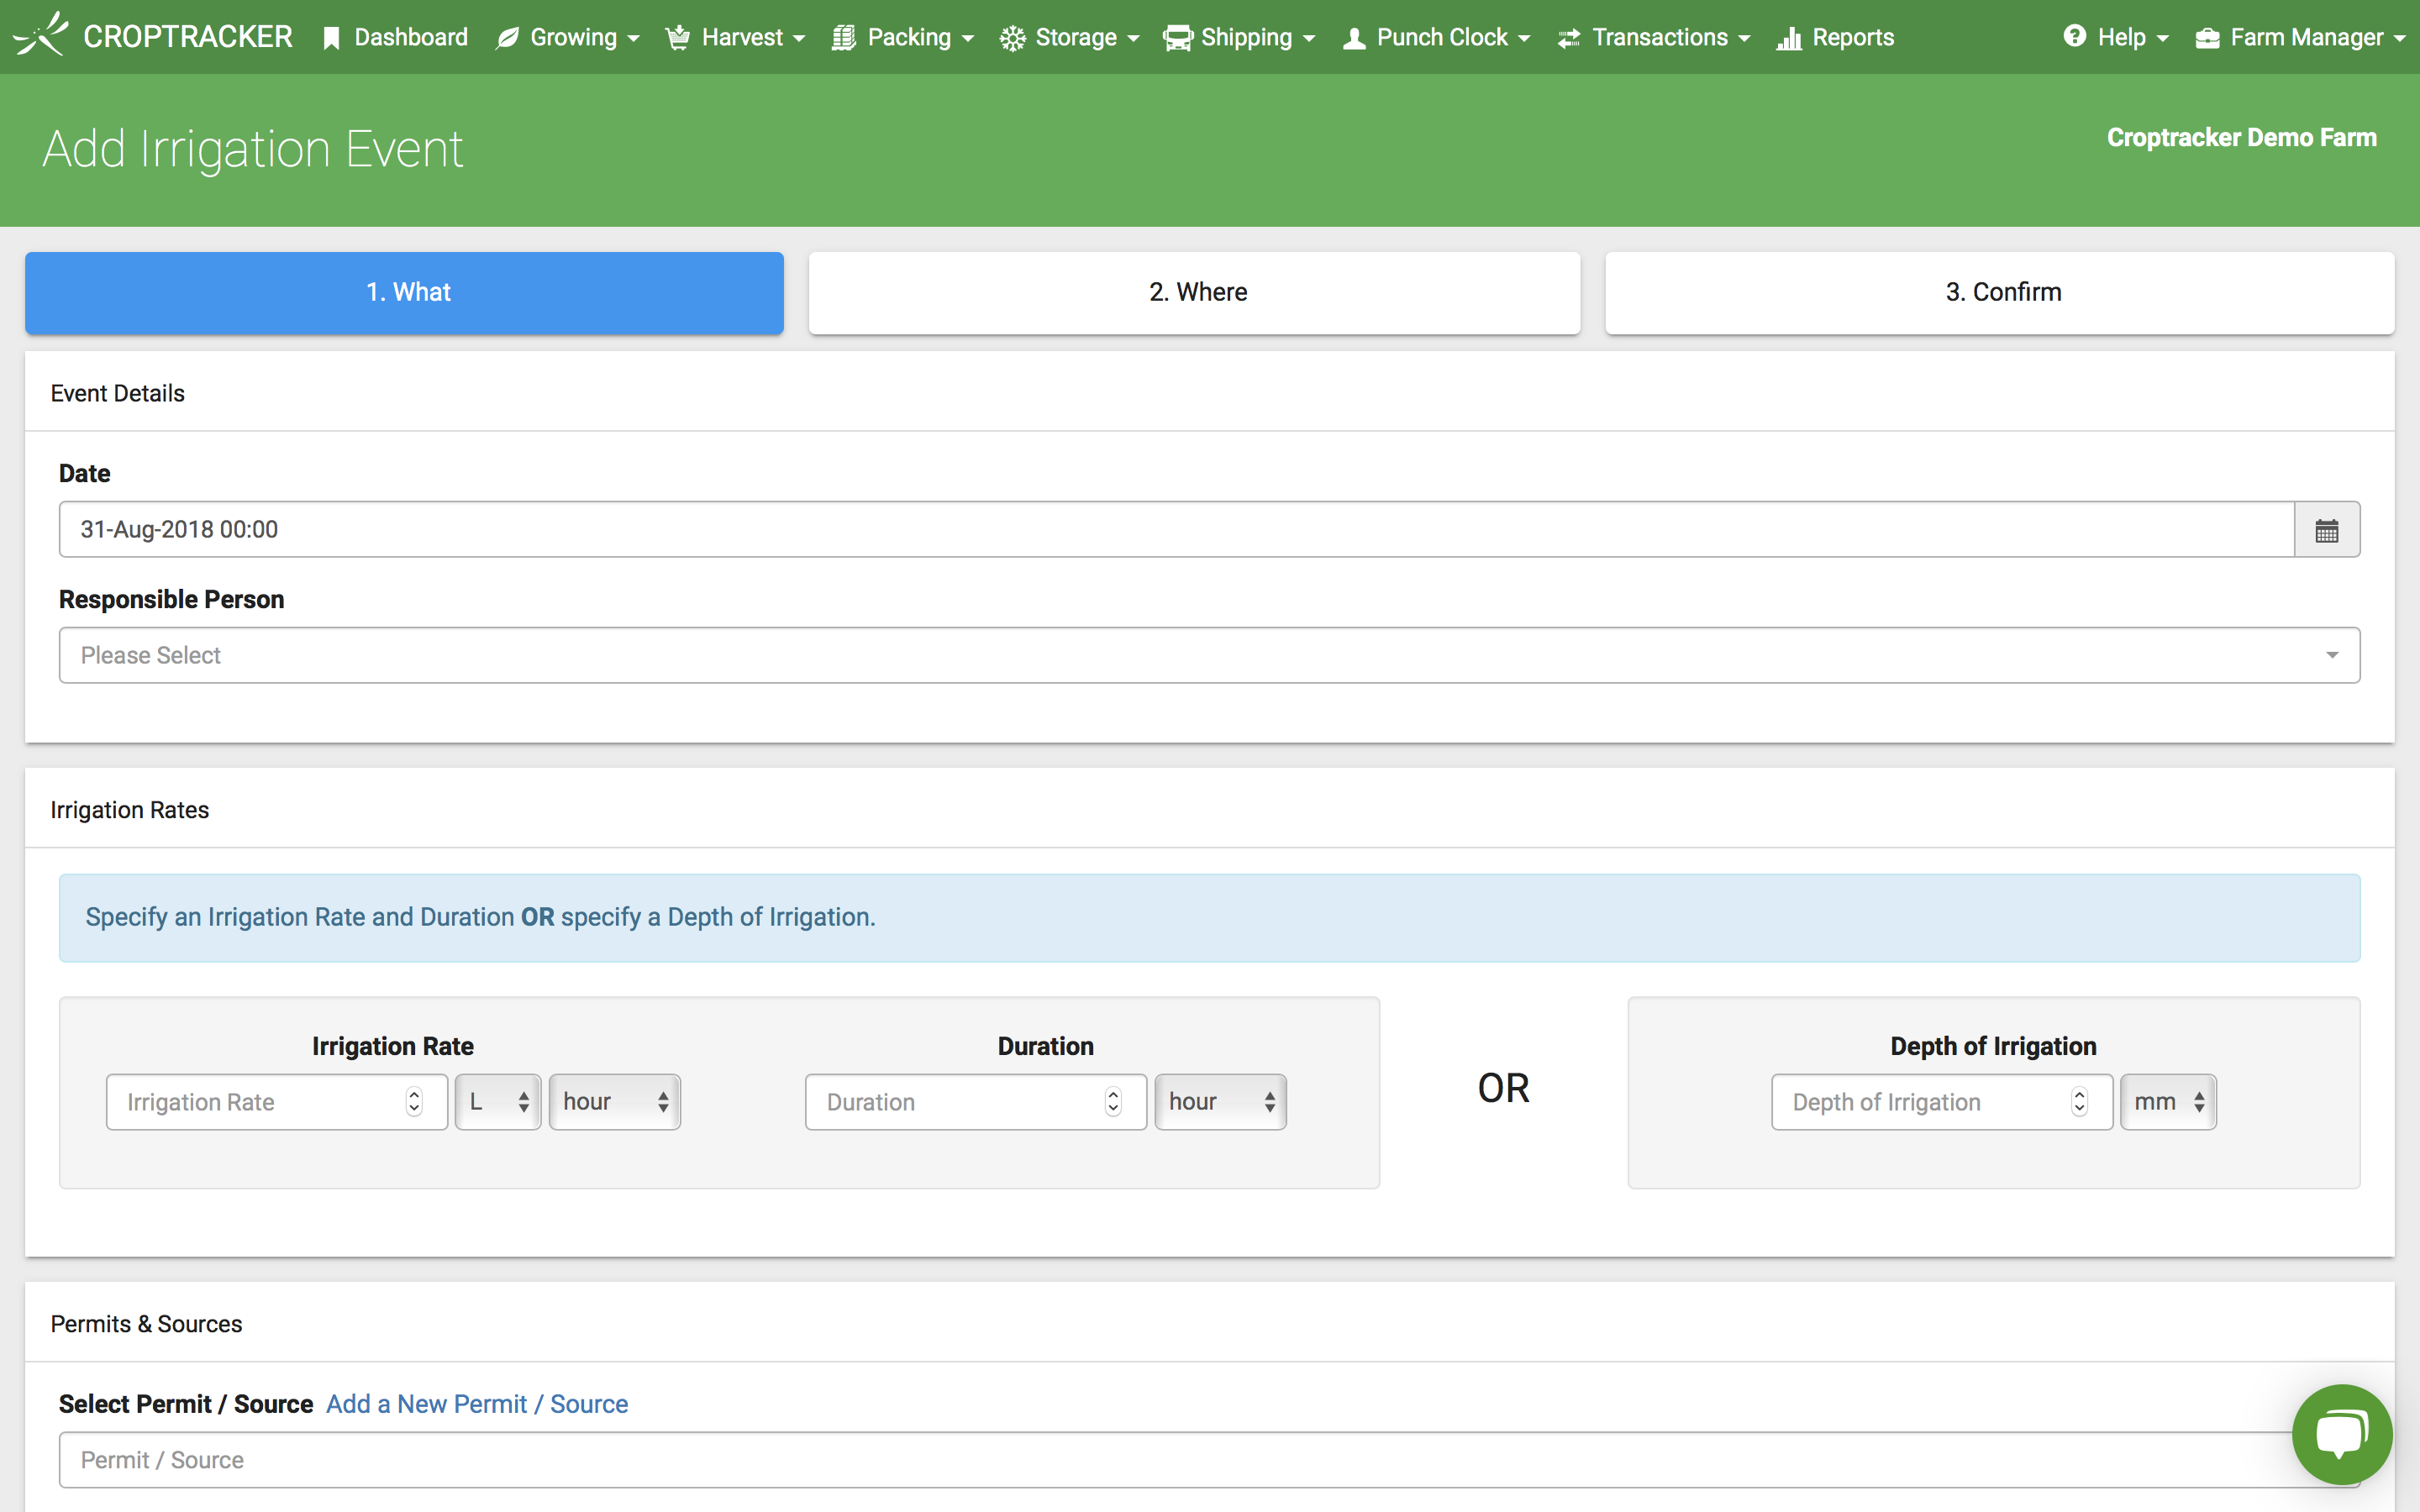
First, click New Irrigation on the Dashboard in the desktop app. That will bring you to the What step of the Add Irrigation Event Wizard in which you can enter the location, date, responsible person, irrigation rate or depth of irrigation, and add a new permit/source for your irrigation.
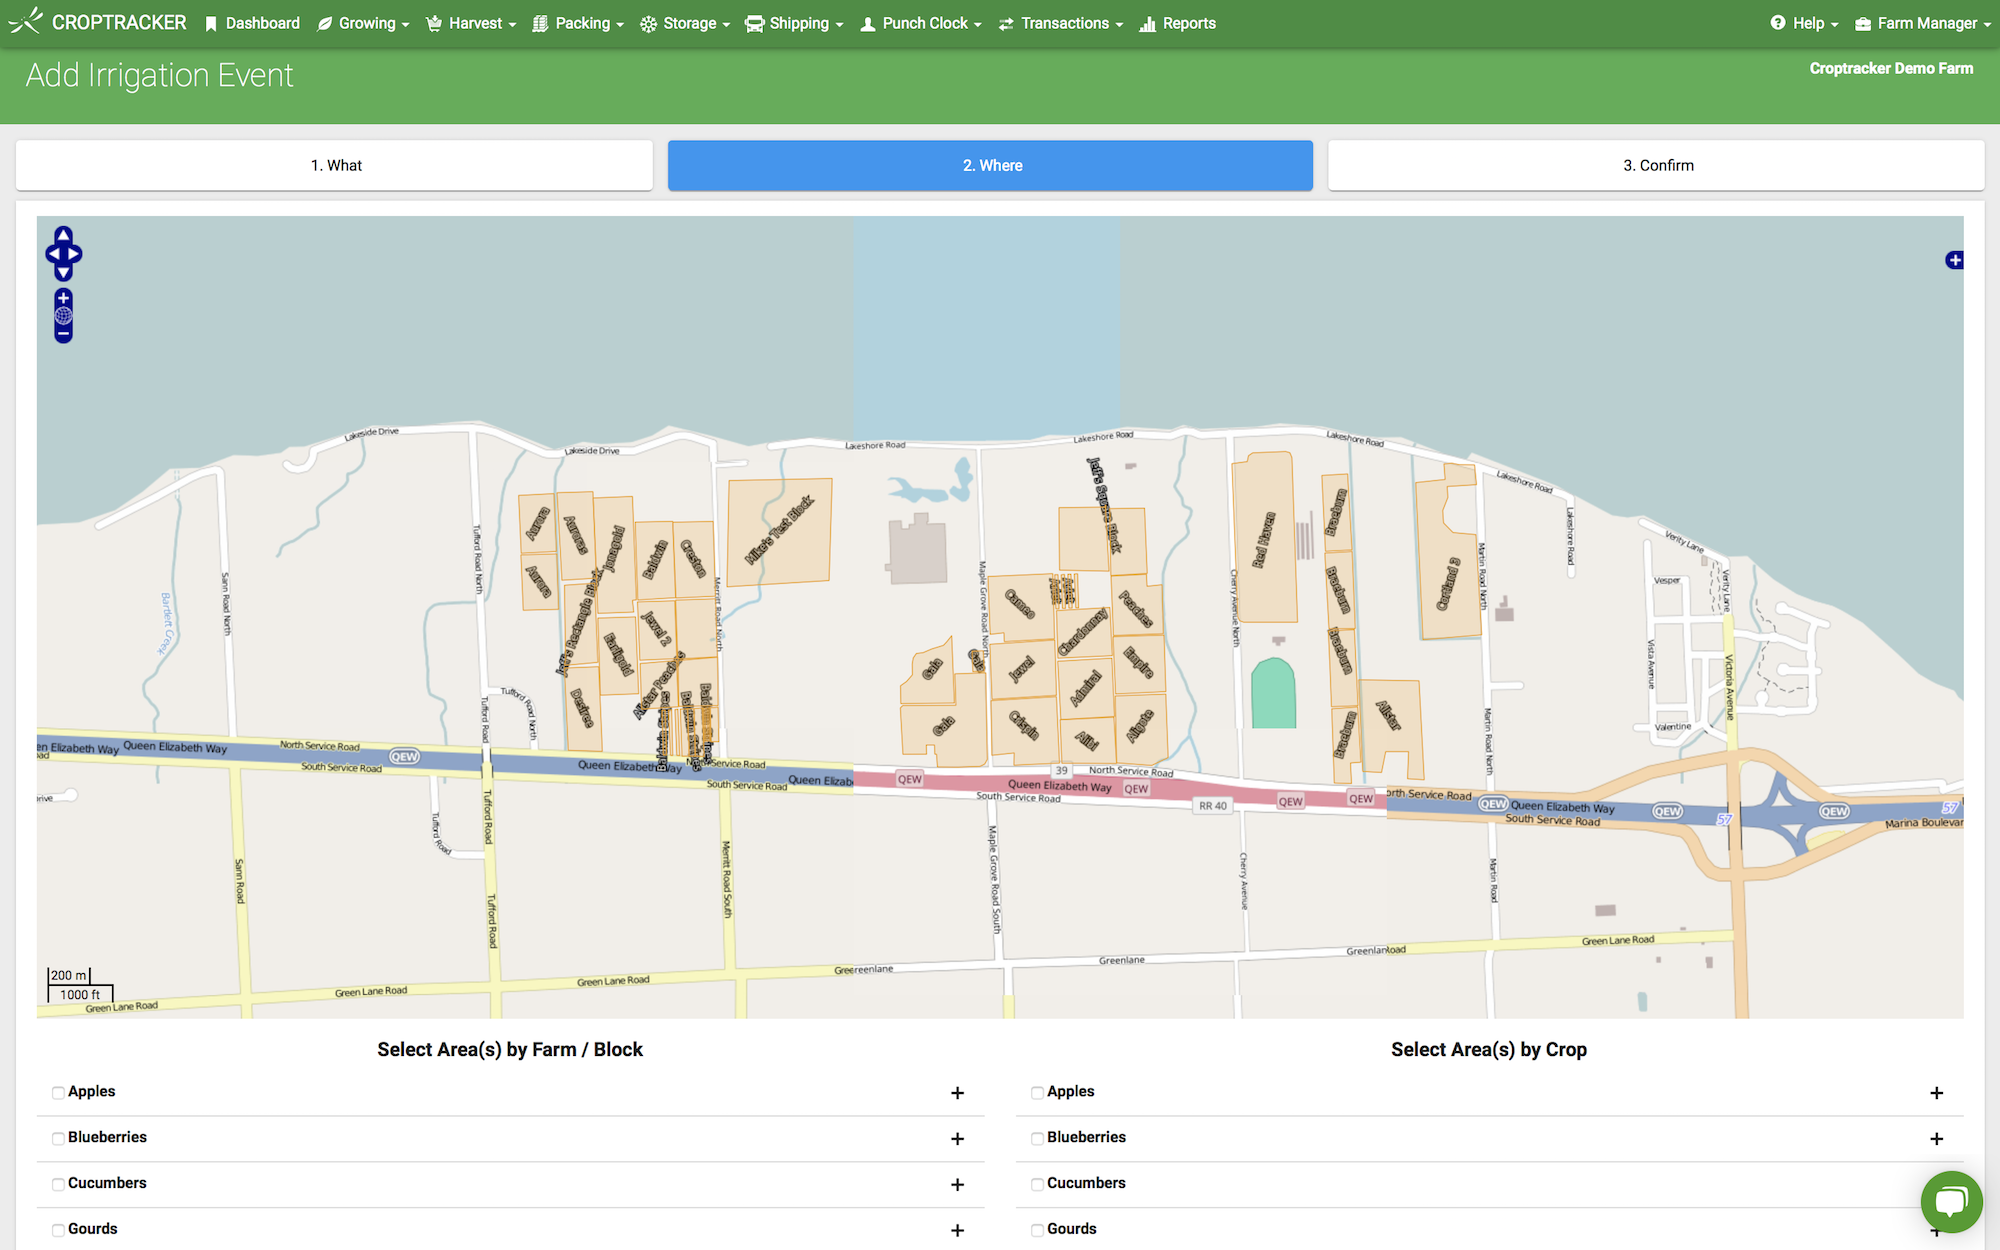
Click Next. You will be brought to the Where step of the Wizard wherein you can either select the affected blocks on the map, or select the area(s) by farm/block or crop from the checkboxes below.
ClickNext. Here on the Confirm step in the Wizard you can leave any comments or notes - note that comments will appear on some reports while notes will not and are solely for your own reference purposes.
You will also see on this page that Croptracker will automatically calculate the acreage amounts and litres to be applied based on the areas and rates/depths you specified earlier in the What step.
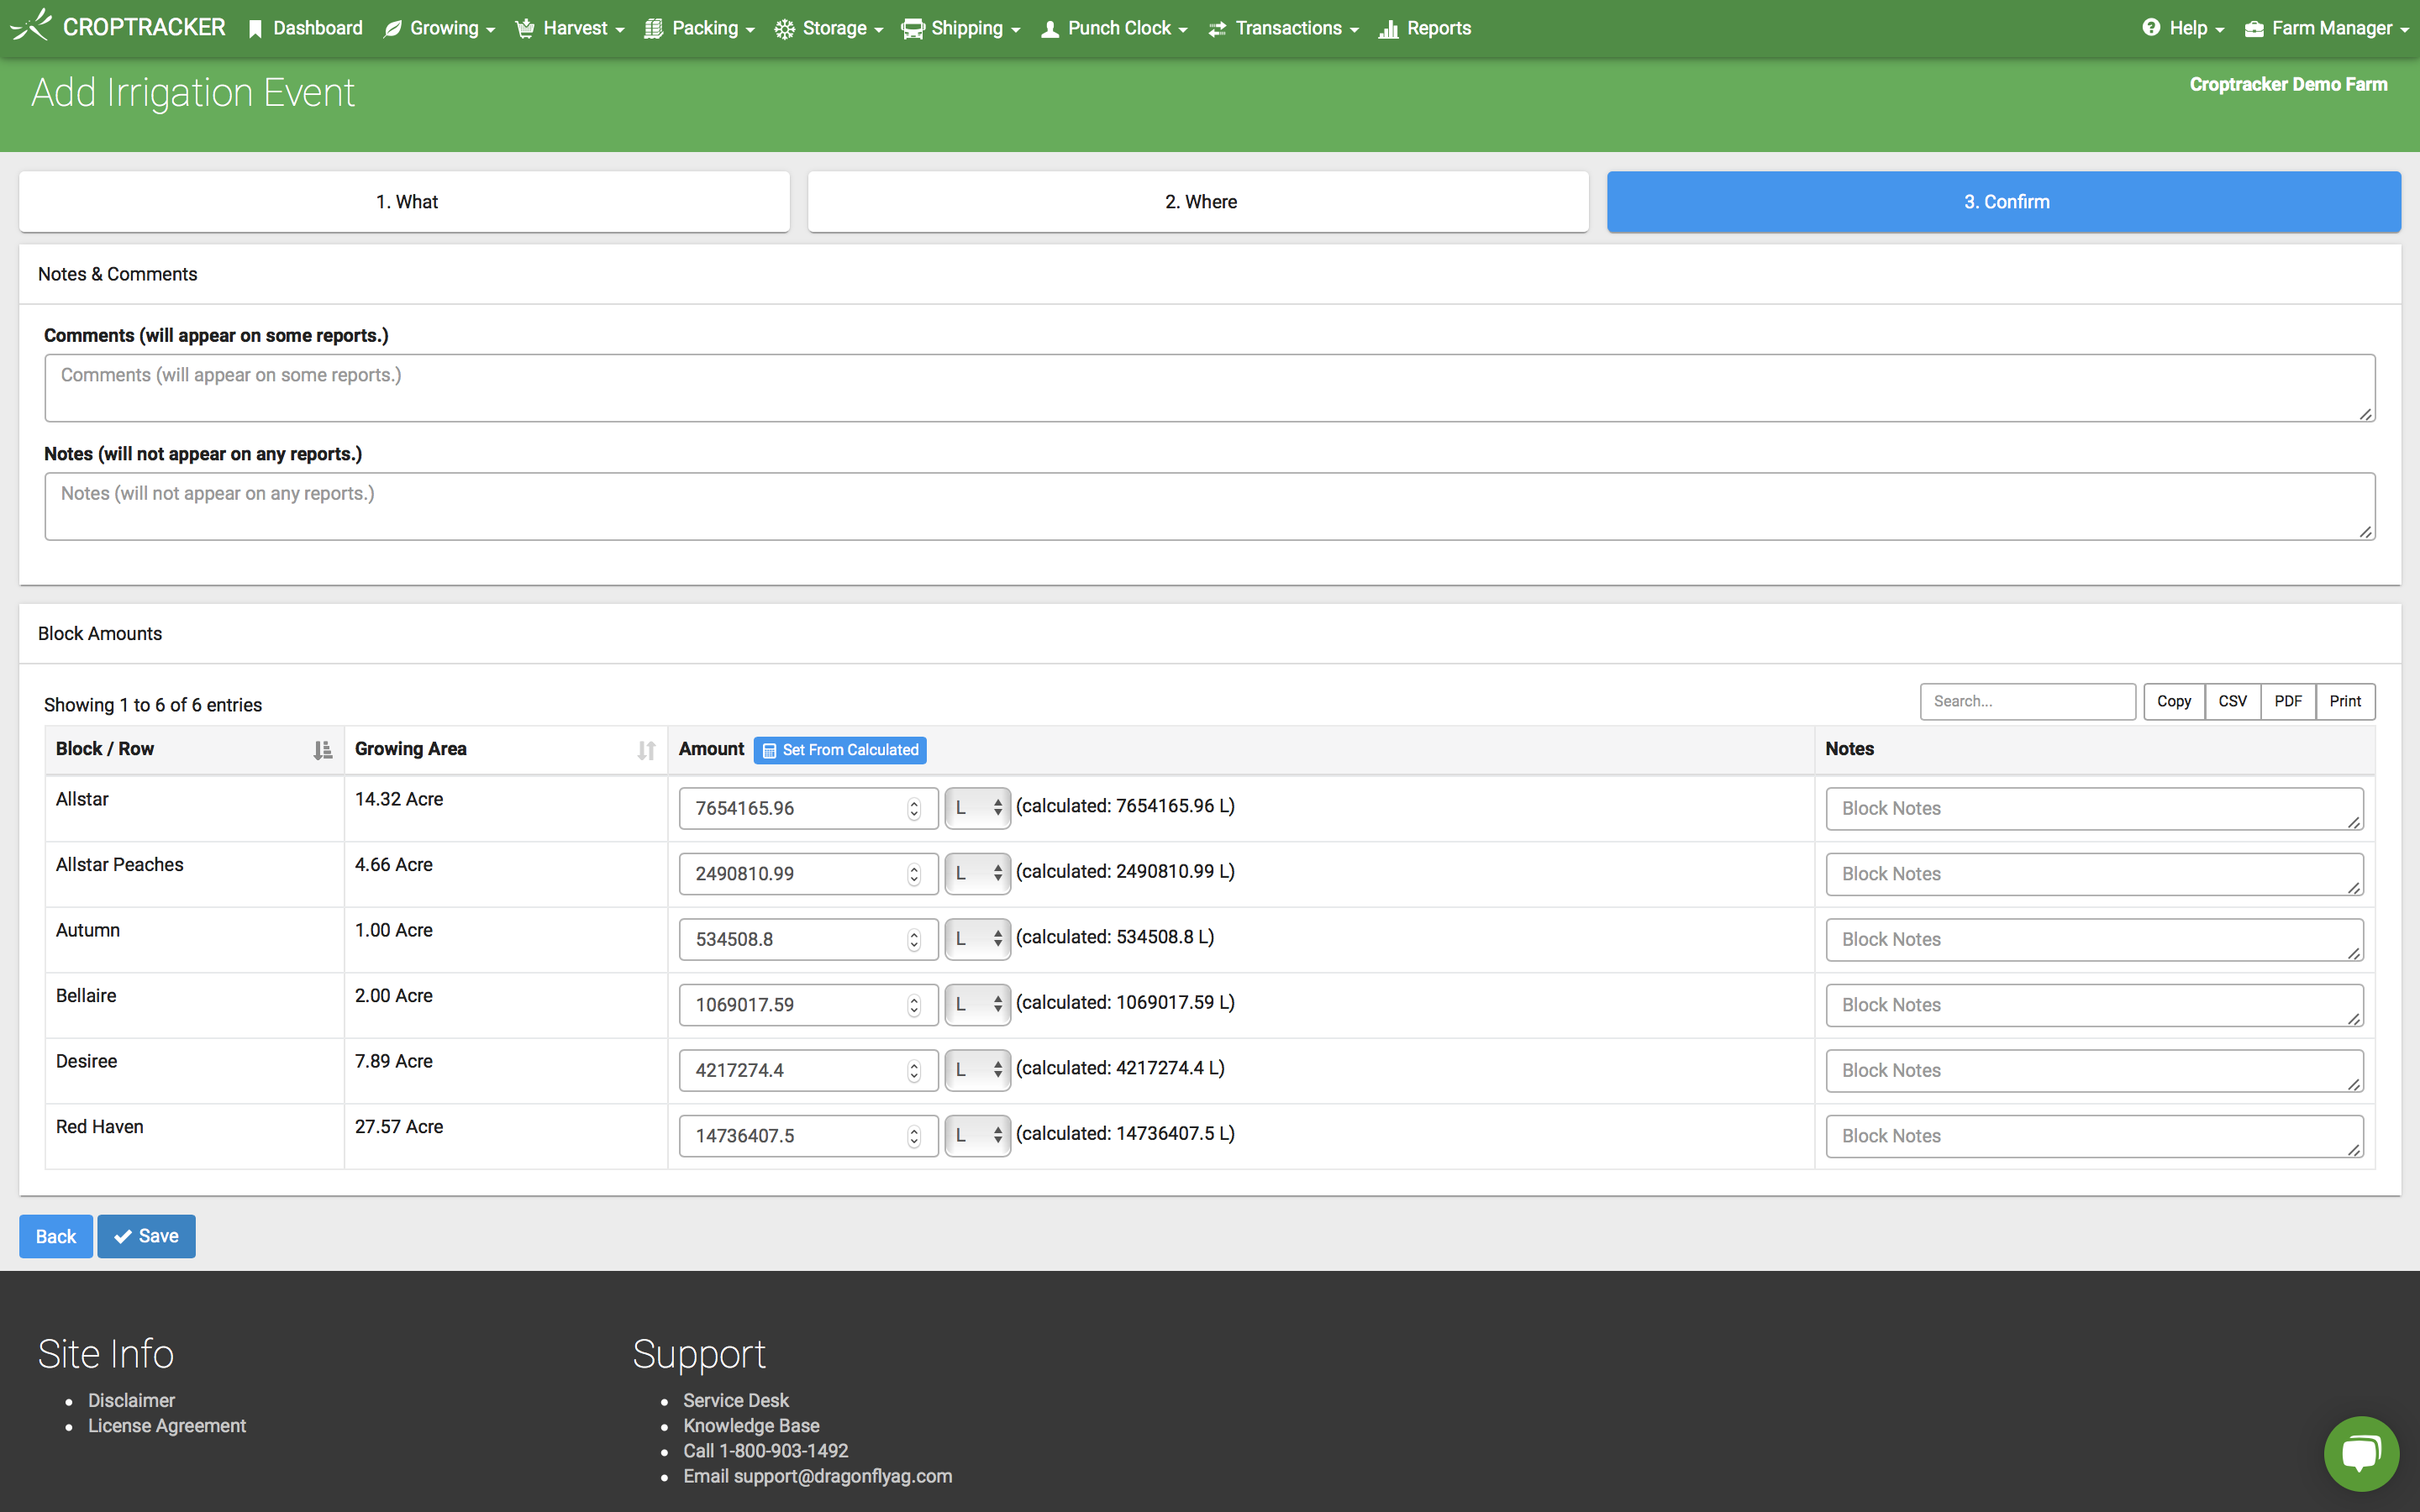
You can then Save your event. Croptracker will store all the data for future use and analysis, and can generate reports based on your past entries in a single click whenever you need to take a bird's-eye look at your irrigation history.
Reports
Navigate to Reports in the top pane of the desktop app and scroll down to the Irrigation Report Category (or press Ctrl+F and enter "Irrigation" in the search bar). Click Irrigation Permit Report to view your past sprays. Use the filters on the left-hand side to filter by block, date, and/or permit/source. If you are in Ontario, Canada, there is also a version of this report specifically designed for submission to your Ministry of Environment called Irrigation MOE Report, also found on the previous Reports list.
Need a refresher on any of Croptracker's features? Head over to our Knowledge Base, where you'll find step-by-step tutorials as well as common troubleshooting tips and more. And as always, if you're ever stuck, never hesitate to e-mail us at support@croptracker.com or Live Chat with us by clicking the green speech bubble ![]() in your bottom right-hand corner. We're always happy to help you let Croptracker make your farm become more efficient, safe, and profitable!
in your bottom right-hand corner. We're always happy to help you let Croptracker make your farm become more efficient, safe, and profitable!
| Missed Last Week's Blog Post? Groundbreaking "Cold Lightning" Treatment Eliminates Fruit Mold |